Silica Nanoparticles for the Stabilization of W/O Emulsions at HTHP Conditions for Unconventional Reserves Drilling Operations
1
UCP, ENSTA ParisTech, Université Paris-Saclay, 828 Boulevard des Maréchaux, 91762
Palaiseau - France
2
ORS, 9 Avenue Percier, 75008
Paris - France
3
Mines ParisTech, 828 Boulevard des Maréchaux, 91762
Palaiseau - France
e-mail: This email address is being protected from spambots. You need JavaScript enabled to view it.
* Corresponding author
Received:
12
December
2016
Accepted:
9
June
2017
Abstract
A novel generation of drilling fluids based on the principle of Pickering emulsions was prepared in this work using three different types of commercial silica nanoparticles with various hydrophobicity and particle sizes. We demonstrated that a threshold of nanoparticles concentration was necessary to stabilize the emulsions which strongly depended upon the particles wettability (hydrophobicity) and sizes. Nonetheless, on increasing the water phase volume fraction, a catastrophic inversion from Water-in-Oil (W/O) to Oil-in-Water (O/W) was obtained for emulsions prepared using amphiphilic silica nanoparticles. Particles wettability has proven to be strongly affected by the pH of the aqueous phase. However, changing the salinity of the brine phase did not have remarkable effects neither on the stability to coalescence/sedimentation nor on the droplet size distribution of the emulsions prepared. Oscillatory rheology illustrates that addition of clay particles boosts fluids thixotropic properties which experienced full recovery of gel strength even after aging. The drilling fluids prepared were aged for 16 h at 350 °F (177 °C) and 500 psi (35 bar) and provided high stability contrary to surfactant stabilized Oil-Based-Mud (OBM) that failed completely after aging.
© R. Ghosn et al., published by IFP Energies nouvelles, 2017
 This is an Open Access article distributed under the terms of the Creative Commons Attribution License (http://creativecommons.org/licenses/by/4.0), which permits unrestricted use, distribution, and reproduction in any medium, provided the original work is properly cited.
Nomenclature
γ : Shear rate, 1/t, s−1
θ : Contact angle
μ : Viscosity, m/Lt, cp
τ : Shear stress, m/Lt2, Pa
 :
Water volume fraction, dimensionless
:
Water volume fraction, dimensionless
BET: Brunauer-Emmett-Teller
CNT: Carbon Nano-Tube
ES: Electrical Stability
GO: Graphene Oxide
G′: Storage modulus, m/Lt2, Pa
G′′: Loss modulus, m/Lt2, Pa
K : Consistency index, dimensionless
n : Flow index
PV : Plastic Viscosity
YP : Yield Point
Introduction
The ever-increasing demand for energy, coupled with depletion of accessible reserves worldwide, is expected to uphold the growing interest in discovering unconventional plays that have the potential to drive oilfield operations into new technology frontiers. According to the US Department of Energy (DOE), 67% of all US oil remains in place and will increasingly require advanced technologies to recover it. Thus, oil and gas development from exploration to drilling, to exploitation and production, is facing increasing technical challenges regarding changes in the operational depth, maximization of production, the complexity of drilling operations and the shape of wellbore profiles. Hence, all lead to an increase in operating costs and limit drilling and production technology development.
From the US Energy Information Administration (EIA) (www.eia.gov), the drilling process comprises eighty percent of well cost. Thus, each successful drilling operation requires specialized drilling fluids to fulfill these objectives (Caenn et al., 2011).
Drilling fluids should perform mandatory functions while drilling, such as: cutting removal, lubricating drilling tools, preserving wellbore stability and minimizing formation damage, etc. (Rogers, 1948).
Many drilling mud types can be formulated to serve drilling needs. Depending on the characteristics of the base fluid, drilling fluids are classified into two main categories: Water-Based-Mud (WBM) and Oil-Based-Mud (OBM) (Aqueous and Non-aqueous, respectively). However, at high temperature and high pressure, drilling fluids are likely to exhibit thermal degradation and breakdown of surfactants/emulsifiers leading to drastic inconveniences such as sagging, syneresis and formation damage, etc. (Davison et al., 1999; Garcia and Parigot, 1968).
Emulsions stabilized solely by solid particles or Pickering emulsions (Ramsden, 1903) are based on the principle of strong adsorption of solid particles at the oil/water interface resulting in an insoluble solid skin around each dispersed droplet. However, this strong adsorption is governed by the surface nature of the particles and a relevant parameter is their contact angle (θ). In other words, the ability of particles to stabilize an emulsion depends on its wettability by both phases of the emulsion.
In many ways like the surfactants Hydrophilic-Lipophilic-Balance (HLB) number, the contact angle determines the type of the emulsion that particles can stabilize. Particles with contact angle, measured into the water phase, less than 90° tend to stabilize Oil-in-Water (O/W) emulsions and they are said to be hydrophilic. However, those with θ > 90° tend to stabilize Water-in-Oil (W/O) emulsions and they are said to be hydrophobic.
Ramsden was the first to adopt this subject and proved that solid particles can stabilize emulsions (Ramsden, 1903). Nonetheless, several studies (Aveyard et al., 2003; Binks and Lumsdon, 2000a; Binks and Whitby, 2005; Binks et al., 2007) have widely characterized the effect of particles wettability (hydrophobicity) and sizes on the stability to creaming/sedimentation of O/W and W/O emulsions.
Pickering emulsions have recently entered the oil and gas sector (Amanullah and Al-Tahini, 2009; Kong and Ohadi, 2010; Mostafavi et al., 2011; Nabhani and Emami, 2012; Zhang et al., 2010). However, few works have been published on the ability of replacing conventional surfactant-stabilized OBM by Pickering emulsions (Hoelscher et al., 2012). Graphene Oxide (GO) nanoparticles were used to enhance the drilling fluids viscosity profile. However, they had a critical issue in long-term stability and never been tested at High-Temperature High-Pressure (HTHP; Agarwal et al. 2013; Anderson, 1986; Sharma et al., 2015; Wagle et al., 2015). Nonetheless, Carbon Nano-Tubes (CNTs) were proven to enhance the rheological profile of drilling muds at under extreme HTHP (600 °F). However, they had high fluid loss control issues as well as they were not used to stabilize the emulsions (Kwok and Neumann, 1999). The synthesis of a new generation of drilling fluids is capable of withstanding ultra-deep hostile reservoir environments. In this work, three types of silica nanoparticles were used and characterized for the preparation of different drilling fluids. The effect of nanoparticles concentration, Oil-Water-Ratio (OWR), pH of water and brine phase salt concentration were characterized. Their effects reported were: the stability to coalescence/sedimentation, Electrical Stability (ES), the morphology and the fluids rheology. The new generation drilling fluids were aged at 350 °F (177 °C) and 500 psi (35 bar) for 16 h and compared with surfactant-stabilized OBM.
1 Materials and Methods
1.1 Materials
Amodrill 1100 synthetic olefin oil purchased from INEOS Oligomers was used as continuous phase for invert emulsions. It has a viscosity of 2 mPa s at 104 °F (40 °C), a density of 0.8 kg/m3 and a boiling point of 534 °F (279 °C). Deionized water was used as dispersed phase which was passed through an osmosis unit and then a Milli-Q reagent water system. Three hydrophobic silica nanoparticles were used (AEROSIL R104, HDK H20 and HDK H17) which properties are presented in Table 1.
Properties of hydrophobic silica particles used.
AEROSIL R104 (Evonik Industries) are fumed silica nanoparticles treated with octamethylcyclotetrasiloxane. However, HDK H20 and HDK H17 (Wacker Chemie) are treated with dimethyldichlorosilane reagent. All nanoparticles are treated to different extents, which are reported in Table 1 by their carbon content as given by the purchasing companies.
The formulation of surfactant-stabilized and solid particle-stabilized drilling fluids include the use of organophilic clay. Thus, ORS VIS, surface modified organophilic clay was used to enhance the thixotropic properties of the emulsions provided by ORS. On the other hand, ORS MUL I and MUL II are respectively the primary and secondary emulsifiers used in this work and were provided by ORS.
1.2 Methods
1.2.1 Sample Preparation
Dispersions of hydrophobic silica nanoparticles (R104, H20 and H17) in oil were prepared by dispersing a known amount of powder in 16 cm3 of oil using a high-intensity ultrasonic processor (Sonics & Materials, tip diameter 13 mm), operating at 20 kHz and up 35% of the maximum ultrasonic power of 750 W for 20 s. Pickering emulsions were prepared by adding slowly 4 cm3 of deionized water to each of the prepared dispersions while ultrasonicating for 3 min. During sonication, samples were immerged in an ice bath to avoid any overheating. The resulting emulsions – white in appearance – were transferred into glass vessels and thermostated at 25 °C. It should be noted that the amount of nanoparticles reported in this work is calculated based on the amount of oil used. For the primary tests and for simplicity reasons an OWR of 80:20 was used.
The types of the emulsions (W/O or O/W) were obtained by observing what happened when a drop of each emulsion was added to a volume of either pure oil or pure water (Binks and Lumsdon, 2000a). W/O emulsions dispersed in oil and remained as drops in water. However, O/W emulsions dispersed in water and remained as droplets in oil. The pH of the water phase was adjusted using NaOH and HCl and varied from 3.5 to 12. The dilution and pH adjustment were achieved at NaOH and HCl concentrations such that the final volume of the dispersion was at the required pH. Nonetheless, CaCl2 salt was used for the preparation of the brine phase. The salt concentration was varied between 0, 5, 15 and 25 wt.%.
1.2.2 Rheology Measurements
Rheological properties of the emulsions prepared were measured using an Anton Paar MCR 302 rheometer coupled with a double-gap cell. Flow curve measurements were used to predict the flow properties of the samples. For that, a rheological model was mandatory; thus, the Herschel-Bulkley model (Eq. 1) was used for offering the best fit to the experimental data obtained. However, it does not give a simple prediction of the plastic viscosity. Therefore, the Bingham-Plastic model (Eq. 2) was as well used.
Herschel-Bulkley model: (1)
(1)
Bingham Plastic model: (2)where τ is the shear stress (Pa), τ
0 the Herschel-Bulkley yield stress (Pa), γ the shear rate (s−1), K the consistency index, n the flow index, YS the Bingham-Plastic yield stress (Pa) and PV is the Bingham-Plastic plastic viscosity (mPa s).
(2)where τ is the shear stress (Pa), τ
0 the Herschel-Bulkley yield stress (Pa), γ the shear rate (s−1), K the consistency index, n the flow index, YS the Bingham-Plastic yield stress (Pa) and PV is the Bingham-Plastic plastic viscosity (mPa s).
Oscillatory rheology was used to measure the visco-elastic behavior of the fluids. That was manifested by exposing a sinusoidal strain at a constant angular frequency of 10 rad/s. From this type of experiment the storage modulus (G′) and the loss modulus (G′′) could be determined. Thereafter, the fluids were sheared at high shear rate to break the gels structure already formed. Finally, the same initial strain was re-applied to measure the ability of the fluids to recover their initial properties after 10 s and 10 min and their gel strength was reported in percentage of the recovery.
1.2.3 Electrical Stability
The breakdown voltage at which the emulsion becomes conductive is an indication of the stability of a W/O emulsion. Therefore, an Electrical Stability (ES) tester purchased from OFITE was used to measure the ES of the emulsions prepared. The measurement consisted of heating 50 cm3 of each sample at 120 °F (49 °C) in a glass cup. The measuring probe was then immerged inside the sample without touching the sides or bottom of the cup. The ES measurements were reported in Volts (V).
1.2.4 Morphology
Microscopy images of the emulsions prepared in this work were obtained using the BHS Olympus microscope fitted with an E-M5II Olympus digital camera. Images were processed using ImageJ software.
1.2.5 Aging
Drilling fluids (200 cm3) were put into an aging cell and heated using a heating jacket at 350 °F (177 °C) and 500 psi (35 bar) for 16 h. Nitrogen gas was used to pressurize the cell. Aged fluids were tested once the cell was cooled down to room temperature and depressurized. Nonetheless, the emulsions were re-mixed for 3 min and re-tested to see if the emulsions could recover their initial properties.
2 Results and Discussions
2.1 Stability to Coalescence/Sedimentation
The effect of nanoparticles concentration on the stability of Pickering emulsions is manifested by the formation of a good protective skin around each dispersed droplet, preventing any possibility of re-coalescence. Hence, by increasing the nanoparticles concentration, the particles adsorption rate at the oil-water interface increases. Therefore, smaller droplets will be generated lowering (and sometimes ceasing) the possibility of re-coalescence.
Figure 1 shows the effect of nanoparticles concentration on the stability to coalescence/sedimentation of the emulsions prepared using the three types of silica nanoparticles described in Table 1. The stability of the emulsions was assessed by measuring the amount of oil separating on top of each sample.
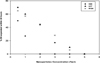 |
Figure 1 Effect of nanoparticles concentration on the stability to coalescence/sedimentation of the emulsions prepared. |
For HDK H20, a concentration of 2 wt.% of nanoparticles was sufficient to generate well covered water droplets that did not show any sign of re-coalescence after homogenization. However, for both AEROSIL R104 and HDK H17, at least 5 wt.% were necessary to stabilize the same amount of water. All tests were done at a constant OWR of 80:20. This difference in nanoparticles concentrations between the various types of silica particles could be related to the difference in wettability and particle size. This could be the effect of different Silane agents having different effects on the wettability of the particles. Thus, H20 which was treated with dimethyldichlorosilane showed a higher affinity to water than R104 which were treated with octamethylcyclotetrasiloxane. Nonetheless, H20 particles generated much higher oil viscosity than both R104 and H17, seeing as how increasing the oil continuous phase viscosity lowers the sedimentation rate and thus helps in stabilizing the emulsions.
Hence, for a further characterization of the particles wettabilities, the contact angles of the particles should be measured with different techniques (Anderson, 1986; Kwok and Neumann, 1999). However, the aim of this work is to formulate stable drilling fluids based on the principle of Pickering emulsions, for which, knowing the corresponding colloidal concentrations responsible for their stabilities was sufficient.
Furthermore, three emulsion systems were established and used for the rest of this work. For all emulsions prepared with HDK H20, 2 wt.% of colloidal particles was used. However, for both R104 and H17, a concentration of 5 wt.% was used instead.
2.2 Effect of OWR
A full characterization in the possibility of using Pickering emulsions for the preparation of drilling fluids imposes the study of the effect of varying the water phase volume fraction ( ). That was done by diluting the samples while maintaining at the same time a nanoparticles-to-oil constant ratio.
The effect of the aqueous phase volume fraction was assessed on both the arithmetic mean particle diameter as well as on the electrical stability of the emulsions prepared.
Figure 2, shows that, for all systems, increasing  lead to an increase in droplet sizes. That can be explained by the fact that decreasing the OWR results in reducing the distance between the water droplets in the oil continuous phase. This induces a lesser amount of nanoparticles at the oil-water interface which in return enhances the possibility of re-coalescence. However, not all systems have undergone the same changes. For R104, it was seen that the mean droplet diameter has increased from 1.83 μm to 3.95 μm at OWR of 90:10 to 50:50 respectively, maintaining a W/O emulsion type even at an OWR of 50:50. Nonetheless, H17 particles followed the same trend with a higher increase in the droplet size especially at 0.4 ≤
  ≤ 0.5, and the emulsions remained W/O. For HDK H20, at 0.1 ≤
  ≤ 0.2, the droplet size did not change significantly. However, a remarkable increase in the droplet mean diameter from 2.41 μm to 7.14 μm at 0.2 ≤
  ≤ 0.3 was obtained. A further increase in the arithmetic mean droplets diameter was obtained for OWR of 60:40 and 50:50, manifested by a catastrophic inversion that started around the OWR 70:30. Thus, emulsions prepared with HDK H20, at
  > 0.4, were definitely O/W. However, at 0.3 ≤
  ≤ 0.4, the emulsion was most probably oil-in-water-in-oil. On the other hand, Figure 3 shows the microscopy images of the emulsions prepared at different OWR. It is remarkable that an increase in the droplet sizes was obtained upon increasing the water volume fraction. Nonetheless, the particles are more compact which enhances the possibility of re-coalescence. However, it is clear that for the H20 particles, a significant increase in the droplets sizes was obtained at the “critical” water volume fraction at the limit of the catastrophic inversion (
 = 0.4).
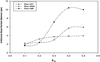 |
Figure 2 Variation of the arithmetic mean particle diameter with the water phase volume fraction for all three nanoparticles types. |
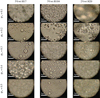 |
Figure 3 Effect of the OWR on the morphology of the emulsions. |
The electrical stability measurements (Fig. 4) were in accordance with the results obtained in Figure 2. Thus, a decrease in the ES stability was obtained while increasing  . Consequently, the formation of larger droplets allowing to easily forming bridges between the two electrodes giving lower electrical stability values. Hence, for both R104 and H17 particles, the stability of the emulsion decreased significantly while increasing the water fraction from 0.1 to 0.3.
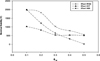 |
Figure 4 Effect of the water phase volume fraction on the electrical stability measurements. |
However, for H17, the ES stability decreased from 1022 V at  = 0.1 to almost stabilize at 503.5 V at an OWR of 70:30. This difference in stabilization mechanism can be related to the difference in particles wettability which can react differently to the increase of the water phase volume fraction.
Nonetheless, for the HDK H20, it was seen that the ES values deteriorated rapidly from a value of 1999 V (maximum) at  = 0.1 to 8 V at
  = 0.5, assuring that a catastrophic inversion took place to form an O/W emulsion which was in accordance with the results obtained by Binks and Lumsdon (2000b).
2.3 Effect of the Aqueous Phase Composition
2.3.1 Effect of pH of Water
It is well-known via zeta potential measurements (Binks et al., 2007) that uncharged silica particles tend to be more hydrophobic than those charged. Nonetheless, the pH of the water phase has a direct influence on the particles charges as silica particles surface charges are very sensitive to pH changes in water. Therefore, the effect of pH on the stability and performance of the Pickering stabilized OBM was assessed via changing the pH of the water phase between 3.5, 5, 7, 10.5 and 12. Hence, the electrical stability and the morphology (variation of the droplets sizes) of the emulsions were reported. It should be noted that all emulsions were prepared at a constant OWR of 80:20.
Starting with HDK H20, increasing the pH from 3 to 7 enhanced the electrical stability of the emulsions prepared (Fig. 5). However, upon increasing the pH from neutral to 12, a decrease of the electrical stability of the emulsions with this type of nanoparticles was seen. That could be related to the increase in hydrophilicity of the particles which may cause the particles to be forced into the water phase at high pH. Nonetheless, this vital change in the electrical stability measurement obtained with this system can be referred to irreversible surface reactions that took place at high pH values which decreased the hydrophobicity of the grafted silica particles. On the other hand, HDK H17 and AEROSIL R104 did not have such behavior. For these types of nanoparticles, the electrical stability of the emulsions was enhanced while increasing the pH of water. This could be the result a decrease in the hydrophobicity of the particles to have a higher affinity to water, increasing the adsorption rate at the oil/water interface. This was confirmed by the microscopy images presented in Figure 6 and was in accordance with the results obtained by Binks (Binks et al., 2007) using fumed silica nanoparticles for particle-stabilized foams. For HDK H20 particles, for 3.5 ≤ pH ≤ 7, the droplets sizes seem not to change. However, for pH > 7, particles tend to coalesce leading to the formation of larger droplets especially at pH = 12. However, for both AEROSIL R104 and HDK H17, an increase in the pH of the aqueous phase lead to a decrease in the particles size of the droplets enhancing at the same time the stability of the emulsions.
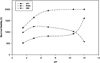 |
Figure 5 Effect of pH of the aqueous phase on the stability of the emulsions prepared. |
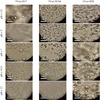 |
Figure 6 Effect of changing the pH of the aqueous phase on the morphology (droplet size distribution) of the emulsions. |
2.3.2 Effect of Salt Concentration
The effect of variation in salinity of the aqueous phase for W/O emulsions can have a complete different effect than that on O/W emulsions. In the latter, nanoparticles are dispersed in the aqueous phase, thus they are directly affected by the change in pH as well as the salt concentration. However, in W/O emulsions, nanoparticles are dispersed in the oil continuous phase and their adsorption at the water interface differs with their wettability (contact angle). For example, silica particles tend to solubilize into water at high pH values. However, no such effect was seen in this work and because particles were dispersed in the oil phase and their contact with the water phase could be limited to their different degree of hydrophobicity (contact angle).
In this work the salt concentration was varied between 0, 5, 15 and 25 wt.% and the salt used was CaCl2 as it is known for the preparation of the brine phase of OBM. As described earlier, the effect of adding salt was reported on both the stability of the emulsions via the electrical stability measurements as well as on the droplet size distribution which was assessed by microscopy images.
Figure 7 shows that for all samples prepared, increasing the salt concentration lowered the electrical stability of the emulsions. However, the emulsions remained stable and no separation occurred. That can be explained by the flocculation behavior of the particles that occurred while increasing the salt concentration. No significant change was seen on the morphology of the emulsions while increasing the salt concentration. That was related to the fact that dissolved salts did not have significant effects on the particles wettability (particles charges) to induce any changes in the particles size distributions.
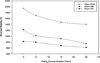 |
Figure 7 Effect of the salt concentration on the stability of the emulsions. |
2.3.3 Effect of Adding Clay Particles
Clay particles are usually added to drilling fluids for their ability to generate high gel-structures as well as thixotropic properties contributing into a better drilling operation (Rate-Of-Penetration (ROP), hole cleaning, etc.). This is coupled with their Cation-Exchange-Capacity (CEC), which allows them to hydrate (swell) when getting in contact with water (Jung et al., 2011). The hydration of the clay particles is controlled by the type and amount of cations associated with them.
In this work, surface modified clay particles (ORS VIS), were added to each of the three systems already described before. Nonetheless, these systems were compared with surfactant-stabilized OBM and reported in terms of electrical stability as well as rheological properties.
Figure 8 and Table 2, show the flow curves (shear stress in function of shear rate) of all the samples prepared and their rheological properties respectively. As aforementioned, two rheological models were used to measure the rheological properties of the fluids, the Bingham-Plastic (BP model) and the Herschel-Bulkley (HB model). The latter was more adapted and fitted better the flow curves obtained. However, it does not provide a simple measurement of the plastic viscosity, thus the usage of the BP model.
 |
Figure 8 Flow curves of various samples prepared compared to surfactant-stabilized OBM. |
Rheological properties of all samples prepared compared with the surfactant-stabilized OBM.
As it can be seen, all samples showed a good shear-thinning behavior as the viscosity decreased while increasing the shear rate. This behavior was complementary with the thixotropic properties measured. It was clear that the addition of clay particles highly increased the rheological properties of the samples. On the other hand, it should be noted that for the preparation of the surfactant-stabilized OBM, the same amount of clay particles was used (2 wt.% ORS VIS).
2.4 Effect of Aging
Surfactants tend to degrade at high pressure and high temperature. Thus, the aim of this work was to replace them with solid silica nanoparticles for their ability to withstand elevate temperature and pressure conditions without losing their emulsifying properties. Therefore, samples were prepared with and without clay particles and aged at 350 °F (177 °C) and 500 psi (35 bar) for 16 h. The electrical stability, morphology as well as the rheological properties of the samples were presented for tests done before/after aging and after re-homogenization.
2.4.1 Without Clay Particles
Figures 9a-9c show the flow curves (shear stress vs. shear rate) of the samples prepared without clay. The corresponding rheological properties were reported in Table 3.
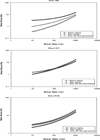 |
Figure 9 Flow curves of all samples prepared without clay particles showing the effect of aging and remixing on the rheological properties. a) 2 wt.% H20, b) 5 wt.% H17 and c) 5 wt.% R104. |
Effect of aging on the rheological properties of samples prepared without clay particles.
For all samples tested, the plastic viscosity and the yield stress decreased after aging.
However, emulsions prepared with H20 presented a big loss of their yield stress that could not be recovered even after re-homogenization. Nevertheless, the other samples seemed to recover most of their properties after re-mixing of the emulsions. Regarding the gel structure of the fluids, Table 4 presents the gel strength at 10 s and 10 min of all three samples.
Effect of aging on the gel strength of the samples prepared without clay particles.
It is remarkable that the gel strength of the samples prepared with H20 deteriorated after aging from 81.1% to 35.7% (for the gel 10 s) and did not recover completely to reach 40.6% after re-homogenization. However, all samples completely recovered their gel structure after 10 min after re-homogenization of the emulsions. As mentioned before, the measurement of the gel strength in this work is based on the recuperation percentage of the fluids with time through applying a constant deformation in the Linear-Viscoelastic region (LVE region) compared to that measured at rest. This allows one to measure through oscillatory rheology the gel structure of visco-elastic fluids with time (Fig. 10).
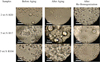 |
Figure 10 Morphology of the emulsions of all samples (without clay particles) before and after aging as well as after re-homogenization. |
2.4.2 With Clay Particles
The effect of adding clay particles on the rheological properties of the emulsions was already seen in Figure 8 and Table 2. Hence, the effect of aging on rheology as well as the electrical stability and the morphology of these emulsions were reported.
Table 5 shows the effect of aging on the rheological properties of samples prepared with clay particles. It should be noted that rheological losses occurred after aging. However, the existence of clay particles enhanced the recovery of the structures especially that of the gel strength measured and reported in Table 6. On the other hand, the surfactant-stabilized OBM separated completely after aging and did not re-emulsify even after mixing indicating the degradation of the surfactants at high pressure and high temperature.
Rheology of samples prepared with clay particles before/after aging and after rehomogenization.
Effect of adding clay on the rheological properties of the samples before/after aging and after re-homogenization.
The electrical stability of all samples was also affected by the aging process of the emulsions. Thus, the measurements were presented in Table 7. It can be clearly seen that a decrease in the electrical stability is obtained after aging for all samples. However, after re-homogenization, most of the samples recovered most of their initial stability where the surfactant-stabilized OBM failed completely after aging.
Effect of aging on the electrical stability of samples prepared with and without clay particles compared to surfactant-stabilized OBM.
2.5 High Pressure High Temperature Rheology
Although High Pressure High Temperature (HPHT) wells are fundamentally constructed, stimulated, produced and monitored in a manner similar to wells with less-demanding conditions, the HPHT environment limits the range of available materials and technologies to exploit these reservoirs. The effect of temperature and pressure on the properties of drilling fluids does not summarize in the stability of the fluids under these conditions but exceeds to reach the ability of these fluids to address their main functions. Pressure and pressure variation have only a slight effect on rheological properties of fluids. Emphasis is placed on the influence of temperature on the rheological properties of drilling fluids. Thus, Figure 11 shows the effect of temperature on the plastic viscosity and the yield stress measured with the Bingham Plastic model at a constant pressure of 75 bar.
 |
Figure 11 Effect of temperature on the rheology of drilling fluids (●) PV and (■) YS. |
It is clear that for all samples the viscosity of the fluids decreased with increasing temperature. However, it should be noted that all Pickering emulsions prepared with silica nanoparticles were prepared without clay particles where the surfactant-stabilized samples had clay particles in their structures. That explains why the surfactant-stabilized fluids had higher plastic viscosity and yield stress than those prepared with H17 and H20.
On the other hand, at temperature as high as 140 °C, the surfactants tend to degrade and a phase separation occurred in the fluids that gave rise to hysteresis in the rheological profile of these fluids. However, all samples prepared with silica nanoparticles remained stable and their properties were reported as shown in Figure 11. It is important to note that R104 gave the highest rheological properties among all samples where the yield stress of the H20 sample showed a slight increase at 180 °C. This can be due to the affection of the particles surfaces at this temperature, giving higher particles interactions and thus a higher yield point.
Samples shown in Figure 12 are of high importance for the drilling operation as the fluids (apart from the R104) conserved a plastic viscosity higher than 10 mPa s even at temperatures as high as 180 °C. However, with the R104 particles, they exhibited yield points as high as 10 Pa at 180 °C. This reflects a high tendency of borehole cleaning and debris transport, two main problems faced with the surfactant-stabilized muds which impose the use of high solid contents. On the other hand, all samples prepared with the three types of silica nanoparticles showed a high stability to coalescence sedimentation even after being exposed to high temperature and pressure. Contrary to the surfactant-stabilized mud that wasn’t reliable at temperatures above 140 °C.
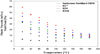 |
Figure 12 Effect of temperature on samples prepared with clay particles (●) PV and (■) YS. |
Conclusions
Revolutionary Pickering synthetic-based drilling fluids for deep and ultra-deep wells were successfully synthesized in this work using three different types of commercial silica nanoparticles of various hydrophobicity.
-
A long-term stability was obtained at a calculated threshold of nanoparticles measured at a constant OWR (over 12 months). Nonetheless, the prepared drilling fluids were able to withstand water-cuts up to an OWR of 50:50. However, amphiphilic silica nanoparticles exhibited a “catastrophic” inversion from W/O to O/W at water phase volume fractions higher than 0.4.
-
Any change in the pH or the salinity of the water phase (water invasion, contact with acid gases, etc.) can alter the stability of the fluids via changing the hydrophobicity of the particles.
-
Good shear-thinning behavior of all emulsions was obtained upon adding clay particles. This could be seen as an enhancement of the hole cleaning capacity of the fluids once coupled with other drilling fluids properties.
-
The drilling muds prepared have demonstrated an improved ability to withstand robust downhole conditions of temperatures and pressures. Thus, almost all of the fluids have exhibited a full recovery of their rheological profiles after aging at 350 °F (177 °C) and 500 psi (35 bar) for 16 h after a simple re-homogenization contrary to surfactant-stabilized OBM that failed completely after aging.
-
The drilling fluids prepared showed a very good shear-thinning behavior at HTHP reservoir conditions (up to 180 °C at 75 bar) which makes them highly more efficient than surfactant-stabilized muds that could not address their functions at temperatures above 140 °C.
Acknowledgments
This work was funded by ORS and the ANRT under the project CIFRE No. 507/2013. Thanks to Evonik Degussa and Wacker Chemie that provided us the silica nanoparticles. Thanks to INEOS Oligomers that provided us the synthetic oil.
References
- Agarwal S., Phuoc T.X., Soong Y., Martello D., Gupta R.K. (2013) Nanoparticle-stabilised invert emulsion drilling fluids for deep-hole drilling of oil and gas, Can. J. Chem. Eng. 91, 1641–1649. [CrossRef] [Google Scholar]
- Amanullah M., Al-Tahini A.M. (2009) Nano-technology-its significance in smart fluid development for oil and gas field application, SPE Saudi Arabia Section Technical Symposium, 9-11 May, AlKhobar, Saudi Arabia, SPE-126102-MS. [Google Scholar]
- Anderson W. (1986) Wettability literature survey-part 2: Wettability measurement, J. Pet. Technol. 38, 11, 1246–1262, SPE-13933-PA. [Google Scholar]
- Aveyard R., Binks B.P., Clint J.H. (2003) Emulsions stabilised solely by colloidal particles, Adv. Colloid Interface Sci. 100, 503–546. [CrossRef] [Google Scholar]
- Binks B.P., Lumsdon S.O. (2000a) Influence of particle wettability on the type and stability of surfactant-free emulsions, Langmuir 16, 23, 8622–8631. [CrossRef] [Google Scholar]
- Binks B.P., Lumsdon S.O. (2000b) Catastrophic phase inversion of water-in-oil emulsions stabilized by hydrophobic silica, Langmuir 16, 6, 2539–2547. [CrossRef] [Google Scholar]
- Binks B.P., Whitby C.P. (2005) Nanoparticle silica-stabilised oil-in-water emulsions: Improving emulsion stability, Colloids Surf. A: Physicochem. Eng. Aspects 253, 1, 105–115. [CrossRef] [Google Scholar]
- Binks B.P., Duncumb B., Murakami R. (2007) Effect of pH and salt concentration on the phase inversion of particle-stabilized foams, Langmuir 23, 18, 9143–9146. [CrossRef] [PubMed] [Google Scholar]
- Caenn R., Darley H.C., Gray G.R. (2011) Composition and Properties of Drilling and Completion Fluids, 6th edn., Gulf Professional Publishing, Waltham, MA, USA. [Google Scholar]
- Davison J.M., Clary S., Saasen A., Allouche M., Bodin D., Nguyen V.A. (1999) Rheology of various drilling fluid systems under deepwater drilling conditions and the importance of accurate predictions of downhole fluid hydraulics. SPE Annual Technical Conference, 3-6 October, Houston, Texas, SPE-56632-MS, pp. 489–501. [Google Scholar]
- Garcia C., Parigot P. (1968) Boues de forage, Technip edition, Paris. [Google Scholar]
- Hoelscher K.P., De Stefano G., Riley M., Young S. (2012) Application of nanotechnology in drilling fluids. Presented at SPE International Oilfield Nanotechnology Conference and Exhibition, 12-14 June, Noordwijk, The Netherlands, SPE-157031-MS. [Google Scholar]
- Jung Y., Barry M., Lee J.K., Tran P., Soong Y., Martello D., Chyu M. (2011) Effect of nanoparticle-additives on the rheological properties of clay-based fluids at high temperature and high pressure. AADE National Technical Conference and Exhibition, 12-14 April, Houston, Texas. [Google Scholar]
- Kong X., Ohadi M. (2010, January) Applications of micro and nano technologies in the oil and gas industry-overview of the recent progress. Abu Dhabi international petroleum exhibition and conference. Society of Petroleum Engineers, Abu Dhabi, UAE, SPE 138241. [Google Scholar]
- Kwok D.Y., Neumann A.W. (1999) Contact angle measurement and contact angle interpretation, Adv. Colloid Interface Sci. 81, 3, 167–249. [CrossRef] [Google Scholar]
- Mostafavi V., Ferdous M.Z., Hareland G., Husein M. (2011) Design and application of novel nano drilling fluids to mitigate circulation loss problems during oil well drilling operations. Nanotech Conference and Expo, 13, 13-16 June, Boston, p. 15. [Google Scholar]
- Nabhani N., Emami M. (2012) The potential impact of nanomaterials in oil drilling industry, Nanocon, International Conference on Nanomaterials – Research Application, 23-25 October, Brno, Czech Republic. [Google Scholar]
- Ramsden W. (1903) Separation of solids in the surface-layers of solutions and “suspensions” (observations on surface-membranes, bubbles, emulsions, and mechanical coagulation) – Preliminary account, Proceedings of the Royal Society of London 72, 156–164. [CrossRef] [Google Scholar]
- Rogers W.F. (1948) Composition and Properties of Oil Well Drilling Fluids, 1st edn., Gulf Professional Publishing, Houston, Texas. [Google Scholar]
- Sharma T., Kumar G.S., Chon B.H., Sangwai J.S. (2015) Thermal stability of oil-in-water Pickering emulsion in the presence of nanoparticle, surfactant, and polymer, Journal of Industrial and Engineering Chemistry 22, 324–334. [CrossRef] [Google Scholar]
- EIA. Trends in U.S. Oil and Natural Gas Upstream Costs. www.eia.gov, US Energy Information Administration, Report March 2016. [Google Scholar]
- Wagle V., Al-Yami A.S., AlAbdullatif Z. (2015) Using nanoparticles to formulate sag-resistant invert emulsion drilling fluids, SPE/IADC-173004-MS, London, UK. [Google Scholar]
- Zhang T., Davidson D., Davidson D., Bryant S.L., Huh C. (2010) Nanoparticle-stabilized emulsions for applications in enhanced oil recovery. Improved Oil Recovery Symposium. Society of Petroleum Engineers, 24-28 April, Tulsa, Oklahoma, USA, SPE-129885-MS. [Google Scholar]
All Tables
Rheological properties of all samples prepared compared with the surfactant-stabilized OBM.
Effect of aging on the rheological properties of samples prepared without clay particles.
Effect of aging on the gel strength of the samples prepared without clay particles.
Rheology of samples prepared with clay particles before/after aging and after rehomogenization.
Effect of adding clay on the rheological properties of the samples before/after aging and after re-homogenization.
Effect of aging on the electrical stability of samples prepared with and without clay particles compared to surfactant-stabilized OBM.
All Figures
|
Figure 1 Effect of nanoparticles concentration on the stability to coalescence/sedimentation of the emulsions prepared. |
| In the text | |
|
Figure 2 Variation of the arithmetic mean particle diameter with the water phase volume fraction for all three nanoparticles types. |
| In the text | |
|
Figure 3 Effect of the OWR on the morphology of the emulsions. |
| In the text | |
|
Figure 4 Effect of the water phase volume fraction on the electrical stability measurements. |
| In the text | |
|
Figure 5 Effect of pH of the aqueous phase on the stability of the emulsions prepared. |
| In the text | |
|
Figure 6 Effect of changing the pH of the aqueous phase on the morphology (droplet size distribution) of the emulsions. |
| In the text | |
|
Figure 7 Effect of the salt concentration on the stability of the emulsions. |
| In the text | |
|
Figure 8 Flow curves of various samples prepared compared to surfactant-stabilized OBM. |
| In the text | |
|
Figure 9 Flow curves of all samples prepared without clay particles showing the effect of aging and remixing on the rheological properties. a) 2 wt.% H20, b) 5 wt.% H17 and c) 5 wt.% R104. |
| In the text | |
|
Figure 10 Morphology of the emulsions of all samples (without clay particles) before and after aging as well as after re-homogenization. |
| In the text | |
|
Figure 11 Effect of temperature on the rheology of drilling fluids (●) PV and (■) YS. |
| In the text | |
|
Figure 12 Effect of temperature on samples prepared with clay particles (●) PV and (■) YS. |
| In the text | |