Regular Article
Mechanical properties and X-ray diffraction analyses of clay/sand pellets for CO2 adsorption: the effects of sand content and humidity
Grupo de Investigación Aplicada en Materiales y Procesos (GIAMP), School of Chemical Sciences and Engineering, Yachay Tech University, Hda. San José s/n y Proyecto Yachay, 100119 Urcuquí, Ecuador
* Corresponding authors: Cette adresse e-mail est protégée contre les robots spammeurs. Vous devez activer le JavaScript pour la visualiser.
; Cette adresse e-mail est protégée contre les robots spammeurs. Vous devez activer le JavaScript pour la visualiser.
Received:
3
November
2020
Accepted:
17
May
2021
Abstract
In this work, we report the mechanical properties of an alternative material based on a mixture of natural clay and ferruginous sand in pellet form for CO2 capture. These raw materials were collected from Ecuador, and they contain iron and titanium oxides from volcanic origin. To evaluate the effect of the sand content on the mechanical properties of pellets, the samples were manually prepared with 0 (control sample), 15, and 25 wt.% sand contents and analyzed using free-fall drop impact and uniaxial compression tests. The uniaxial compression test was carried out under three conditions: using sieved sand, using sand without sieving, and under wet conditions. The sand contents caused the drop number to decrease in the free-fall drop impact test. From the uniaxial compression test, the compressive strength, elastic modulus, and toughness were calculated. The elastic modulus showed a better performance for samples with lower porosity. The compressive strength demonstrated higher values for samples with 15 wt.% sand contents than for samples with the other sand contents. The toughness values did not significantly change. It was evidenced that the porosity, mineral composition, and humidity exerted an influence during the mechanical tests. The mineral phases were analyzed by X-ray diffraction, and quantitative analysis based on whole-powder-pattern fitting revealed that the iron and titanium oxide contents increased as the concentration of sand in the pellets increased.
© I. Iglesias et al., published by IFP Energies nouvelles, 2021
 This is an Open Access article distributed under the terms of the Creative Commons Attribution License (https://creativecommons.org/licenses/by/4.0), which permits unrestricted use, distribution, and reproduction in any medium, provided the original work is properly cited.
1 Introduction
Power generation and some industries, such as refineries, cement plants, and steel products, are currently responsible for the high emissions of carbon dioxide (CO2) into the atmosphere. Anthropogenic CO2 is mainly the product of the burning of fossil fuels, which has increased its concentration in the atmosphere. The increase in the CO2 concentration has had adverse effects, such as global warming and damage to biodiversity. At present, several strategies exist for mitigating CO2 emissions (Garba and Galadima, 2020; Sifat and Haseli, 2019). The application of Carbon Capture and Storage (CCS) is identified as the most useful strategy owing to its capacity to achieve the objective of the International Energy Agency (IEA) to store at least 1 Gt of CO2 annually by 2030 (IEA, 2017).
CO2 separation from gas mixtures (e.g., flue gas, fuel gas, and natural gas) can be achieved through solid sorbents arranged in fixed beds into adsorption towers. Hakim et al. (2016) reported the adsorption/desorption capacity for CO2 capture using iron oxides and established that hematite has a particular affinity for CO2 adsorption. Baltrusaitis et al. (2007) focused on studying the surface reactions of CO2 at the water–iron oxide interface and determined that the presence of water enhances CO2 adsorption by a factor of five compared to that under dry conditions. Alternative materials for CO2 adsorption have been reported using different porous materials, such as Metal-Organic Frameworks (MOFs) (Ghanbari et al., 2020; Zhao et al., 2014), activated carbon (Al Bahri et al., 2012; Creamer and Gao, 2016; González et al., 2009), mesoporous silica (Rao et al., 2017; Zeleňák et al., 2008; Zhang et al., 2019), zeolites (Garshasbi et al., 2017; Pham et al., 2016) and mineral clays (Chen and Lu, 2015; Guo et al., 2015). The use of mineral clays as CO2 adsorbents has been studied due to their low cost, abundant availability in nature, and high thermal and mechanical stability. However, Chouikhi et al. (2019) pointed out that mineral clays have a low capacity for CO2 adsorption under ambient conditions (CO2 adsorption capacity: 3–18 mg CO2/g sorbent), which is why mineral clays need a pretreatment such as acidic treatment (Cecilia et al., 2018; Komadel and Madejová, 2013), amine impregnation (Goméz-Pozuelo et al., 2019) or amine grafting (Arencibia et al., 2019) to improve the CO2 adsorption capacity (7–144 mg CO2/g sorbent).
Porous materials must meet technical and economic criteria before their use at the industrial scale; for example, they must have hydrothermal, chemical and mechanical stability, inexpensive raw materials, regeneration capacity, selectivity, appropriate adsorption/desorption kinetics, and low heat capacity (Choi et al., 2009). The study of the mechanical properties of solid sorbents is essential for their technological development and scaling up. The solid sorbents have to demonstrate microstructural and morphological stability during the initial loading of the solid sorbents and the normal operation of fixed bed towers. Commonly used solid sorbents suffer attrition because of the operation conditions caused by the volumetric flow rate, vibration, and temperature (Samanta et al., 2012). The adsorbent breakage leads to environmental and operational implications related to the particles and dust generation inside the adsorption towers (Cavalcanti et al., 2018; Sivrikaya and Arol, 2013).
This work aimed to evaluate the mechanical properties of pellets for CO2 capture prepared with natural raw materials from Ecuador (Lagos et al., 2020). The pellets were prepared from natural clay, which was used as a binder for the ferruginous sand. The sand composition in the pellets was 15 and 25 wt.%. The pellet quality was analyzed under dry and wet conditions. For this purpose, free-fall drop impact and uniaxial compression tests were performed. For the uniaxial compression test, cylindrical specimens were prepared due to the geometric characteristics required in this test. The identification of mineral phases in the pellets was performed by powder X-Ray Diffraction (XRD).
2 Experimental procedure
2.1 Raw materials and initial treatment
The clay samples used were taken from Yantzaza, located in Zamora Chinchipe Province, Ecuador. These samples were dried in an oven at 100 °C for 12 h as initial treatment. Ferruginous sands were taken from Ancon, located in Santa Elena Province, Ecuador. The sand samples were previously dried at 100 °C for 8 h, and then a portion of the samples was sieved. For the sieving process, stainless steel sieves (from Retsch, Germany) were used, and the sieves numbers were 4, 8, 16, 30, and 50 mesh. Finally, the grain size obtained was 300 μm.
2.2 Sample preparation
The pellet preparation was performed manually. First, the clay was mixed with different amounts of sieved sand (promoting a homogeneous dispersion in the mixtures) to obtain samples with sand contents of 0 (control sample), 15, and 25 wt.%. Then, distilled water was added with a dropper (approximately 8% of the total volume), and a 13 mm spherical mold was used to shape the pellets. Finally, the samples were calcined in a Boeco muffle furnace with a temperature ramp of 5 °C/min until reaching 450 °C over 14 h. The specimens for the uniaxial compression test were prepared similar to pellets, although using a 13 × 26 mm cylindrical mold. In these samples, clay was mixed with sieved sand and not sieved sand to obtain specimens with sand contents of 0 (control sample), 15, and 25 wt.%. All the samples were left to rest in distilled water for six days to analyze the humidity conditions. The selected quantities of 15 and 25 wt.% of sand content are based on a commercial sorbent, in which the iron oxide concentration is in a range of 10–30 wt.% (Abatzoglou and Boivin, 2009).
The prepared samples (pellets and specimens) were labeled in three different groups. The first group was named C-304 R X%, the second group was labeled C-304 S X%, and the last group was named C-304 W X%, where C-304 refers to clay, R mentions to sand that was not sieved, S designates sieved sand, W denotes wet conditions, and X% represents the sand content by weight, expressed in a percentage.
2.3 Mechanical property determination
The free-fall drop impact test and the uniaxial compression test were used to determine the mechanical properties of the pellets. The free-fall drop impact test was performed by dropping the pellets from a height of 1.5 m. With the help of a CCD camera, the falls were filmed to obtain the height of the first rebound. At least seven tests were performed for each composition, and each trial had several repetitions or until the pellet ruptured. The drop number provides information on the average number of drops before a pellet fracture is detected.
The uniaxial compression test was performed with a United DSTM electro-mechanical series Universal Testing Machine (UTM). The compression occurred at a constant velocity of 10.9 μm/s. This test follows the ASTM D2166 standard. At least seven specimens were tested with the UTM. The information provided by the UTM gave the diagram force versus deformation relationship; hence, it was normalized. The crushing force was calculated by estimating the maximum peak on the force versus deformation curve. The elastic modulus was calculated by the least-squares method from the stress versus strain curve. The compressive strength was obtained by dividing the crushing strength by the cross-sectional area of the sample. Finally, the toughness value was obtained by integrating the area under the curve stress versus strain; by definition, the toughness is the total energy required to fracture or crack the pellets. All the values were averaged, and the standard deviation was calculated. Also, the ductile or brittle nature of the specimens was recorded.
The relative porosity percentage was estimated once the pellets were prepared and calcined. First, three samples were weighed 3 times with an analytical balance. Then, they were allowed to rest in distilled water for six days. Finally, the samples were removed from the distilled water and weighed on an analytical balance. Equation (1) was used for calculating the relative porosity percentage:
 (1)
(1)
where mf is the mass after the six days of resting in water and mi is the initial mass.
2.4 XRD characterization
XRD analysis was carried out to obtain information about the crystalline phases and the mineral content of the pellets. The powder diffractometer used in this characterization was a Mini-flex-600 from Rigaku with a D/tex ultra 2 detector and 8-positions multipurpose stage. The measurement conditions were 40 kV and 15 mA for the X-ray generator in a sealed tube with a Cu Kα1,2 radiation source. For collecting data, the selected angular region was 2θ = 5–90° with a step width of 0.005°. SmartLab Studio II software was used to identify and quantify the crystalline phases.
The sample preparation procedure for XRD analysis consisted of grinding the pellets of the mixed samples in an agate mortar to a fine powder. The samples analyzed were: (i) the control sample C-304, (ii) pellets with a sand content of 15 and 25 wt.%, (iii) sieved ferruginous sand, all under dry conditions. In order to simplify the crystalline phase identification of magnetic metallic oxides, a portion of sieved ferruginous sand was magnetically separated using a magnet (2 Tesla). Therefore, two different samples were obtained, the enriched metallic ferruginous sand (E.M. ferruginous sand), and the nonmagnetic ferruginous sand (N.M. ferruginous sand).
Last, the experimental procedure steps (raw materials and initial treatment, sample preparation, mechanical property determination, and XRD characterization) are summarized in Figure 1.
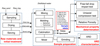 |
Fig. 1 Experimental procedure used in this work. |
3 Results and discussion
3.1 Mechanical properties
The mechanical properties evaluation of the pellets is a necessary step for its industrial scale-up for CO2 capture purposes. An adequate mechanical resistance is required to evaluate the filling behavior of the pellets in an adsorption tower and the stability of the packed bed during the adsorption process to avoid the breakage of pellets. The pellet quality was assessed as a function of the sand quantity in the pellets by the free-fall drop impact test. Also, the uniaxial compression test was used to analyze the influence of the mineral composition, porosity, and humidity in the samples.
3.1.1 Free-fall drop impact test
The free-fall drop impact test is intended to provide information about the response of pellets to collisions that occur during handling, for instance, adsorption tower filling activities. The behavior of the drop number as a function of the sand content in pellets is shown in Figure 2. Regarding the control sample (C-304), the wet and dry conditions exhibited an average of 10 drops (overlapped in Fig. 2); nevertheless, the standard deviation was higher for wet conditions. The sand content in pellets affected the drop number under both conditions; dry pellets showed a decrease with an average of 4 drops for C-304 S 15% and C-304 S 25% with the dry control sample. Similar behavior was evidenced for wet pellets, in which sample C-304 S 25% demonstrated the same drop number (overlapped in Fig. 2) compared to those under dry conditions, in contrast to C-304 S 15%, which was slightly higher with five drops compared with the sample under the dry condition. According to Tavares and de Almeida (2020), the drop number for suitable handling should be at least 4; therefore, all the samples in this study can be considered suitable for handling.
 |
Fig. 2 Drop number as a function of sand contents in pellets under dry and wet conditions. |
Gul et al. (2014) have argued that some factors influence the pellet behavior regarding the mechanical resistance in terms of the drop number, i.e., the type of clays used as binders, moisture, surface area, pellet size, and pelletizing conditions. In this case, the uniformity of the grains is not the same owing to the differences in particle sizes between clay and sand, so it can be deduced that the particle size uniformity due to the increase in sand content influences the mechanical resistance of the free-fall drop impact test.
3.1.2 Uniaxial compression test
From the uniaxial compression test, the elastic modulus, the compression strength and the toughness of the samples were calculated. The compressive strength could provide an idea of the pellet behavior under the operational conditions of the packed bed in adsorption towers. The mineral composition, humidity, and porosity play essential roles in the behavior of the samples against uniaxial compression; in fact, this could be evidenced in the three different conditions of specimens. The results showed different tendencies of the specimens concerning the mechanical resistance under compressive forces.
The compressive strength of the control sample was higher under dry conditions than under wet conditions (Fig. 3a). The highest compressive strength values were for the specimens with a 15 wt.% sand content: the C-304 S 15% sample, followed by the C-304 R 15% sample (Fig. 3b). The samples that showed the least resistance were those that were moistened with water (C-304 W 15% and C-304 W 25%). It was expected that the control sample would show a higher compressive strength due to the absence of sand; however, the values of C-304 S 15% and C-304 R 15% were higher than the control sample. These values could be related to relative porosity; samples with higher compressive strength values demonstrated a lower porosity percentage. However, samples with 25 wt.% sand contents did not have higher compressive strength values than samples with 15 wt.% sand contents even though they had less porosity. This could be related to the mineral composition because under compressive forces, minerals with higher hardness, such as hematite, quartz, and ilmenite, show breakage at lower stress due to contact with other soft mineral phases. The lower porosities of C-304 S 15% and C-304 S 25% could be related to the sand content since these particles fill the void space. According to Howarth and Rowlands (1986), high porosity is responsible for creating microfracture networks that distribute stress under compression. The porosity percentage values are summarized in Table 1. It was evidenced that the samples under wet conditions showed the lowest compressive strength.
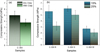 |
Fig. 3 Compressive strength of the specimens: (a) dry and wet control samples and (b) specimens with sand contents under different conditions: sand that has not been sieved (R), sieved sand (S), and wet conditions (W). |
Relative porosity percentage of pellets with different sand contents.
The crushing force is a determining factor for using clay as a binder since it must meet certain criteria. According to Kawatra and Ripke (2002), a vital performance principle for a binder should be a minimum of 22.5 N per pellet under the dry state. The crushing force values in the uniaxial compression test were considerably higher than the minimum value based on the required quality of an acceptable binder (Fig. 4); therefore, under different conditions, the values are suitable even under wet conditions such as post-combustion.
 |
Fig. 4 Crushing force of the specimens: (a) dry and wet control samples and (b) specimens with sand contents under different conditions: sand that has not been sieved (R), sieved sand (S), and wet conditions (W). |
The highest elastic modulus values presented the samples C-304 S 25%, and it exceeded the values of the C-304 S 15% and the control sample with a minimum difference (Fig. 5). This result could be attributed to the relative porosity; however, the standard deviation is high. Based on the literature, the results obtained show the trend that authors have argued about in terms of the elastic behavior of porous and brittle materials; they reported that the higher the porosity is, the lower the elastic modulus values are (Asmani et al., 2001; Schöpfer et al., 2009). Samples without sand that was sieved exhibited lower values than samples with sieved sand. Also, the presence of water decreases the elastic modulus considerably. It is important to point out that the results for the main elastic modulus values were achieved from the best linear fit, such that the values were greater than 0.9855.
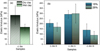 |
Fig. 5 Elastic modulus of the specimens: (a) dry and wet control samples and (b) specimens with sand contents under different conditions: sand that has not been sieved (R), sieved sand (S), and wet conditions (W). |
For toughness measurements, the control samples showed similar values under dry and wet conditions (Fig. 6a); nevertheless, the standard deviation was higher for wet conditions. In addition, the toughness exhibited identical values for C-304 S 15% and C-304 R 15%; moreover, for samples with 25 wt.% sand contents, the toughness decreased (Fig. 6b).
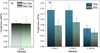 |
Fig. 6 Toughness of the specimens: (a) dry and wet control samples and (b) specimens with sand contents under different conditions: sand that has not been sieved (R), sieved sand (S), and wet conditions (W). |
Under compressive forces, the crack energy disperses in the material and leads to the formation of surface cracks. Consequently, the crack propagation leads to a rupture due to the void space caused by the pore. On the other hand, samples with 15 wt.% sand contents have higher toughness values than the control samples because they have lower porosity; therefore, they can accumulate more energy before rupture occurs (Kuruppu and Chong, 2012). In general, the toughness values were low, which could be attributed to brittle behavior.
In general, the wet samples demonstrated a lower mechanical resistance under all conditions against uniaxial compression testing. It is argued by Erguler and Ulusay (2009) that the higher the water content in clays is, the lower the mechanical resistance under compressive forces. The reduction in mechanical properties may be due to the development of hydraulic pressure in the pores filled with water, affecting the stresses among grains during compression. Additionally, the alteration of some of the minerals comprising the pellets under wet conditions can affect the mechanical properties. In this case, the samples were kept in distilled water for six days for analysis under extreme conditions. In this way, the samples were saturated with water, which is why the noteworthy decrease in their mechanical properties under compression forces. The study of samples under wet conditions is important because, during CO2 adsorption processes at the industrial scale, the condensed water can be present in the system. The water is either contained in the gas stream (steam water or condensed water) or is a reaction product between CO2 and iron oxides; hence, the mechanical properties of the adsorbent could be affected.
The samples without sand that was sieved demonstrated lower mechanical resistance than samples with sieved sand. This result could be attributed to the mineral composition in the samples; for instance, the higher quartz abundance of samples mixed with sand that was not sieved. According to Sousa (2013), at higher quartz contents, the uniaxial compressive strength decreases due to an increase in quartz–quartz contact, which reduces the capacity of the samples to accommodate the deformation. A similar behavior could be attributed to the ferruginous sand because minerals that makeup it, such as magnetite and ilmenite, have high hardness values (approximately 6 on the Mohs scale) (Hu et al., 2011). Consequently, at higher sand contents, the contact among the metallic oxides and other minerals increases, which can make the occurrence of a fracture easier. Minerals that contain hydroxyl and water molecules (kaolinite and muscovite) have lower hardness, meaning that they are easier to break when they come into contact with other minerals with a higher hardness under compressive forces.
The specimens after the fracture during the uniaxial compression test are shown in Figure 7. The specimens had longitudinal cracks throughout the samples, which indicated a brittle behavior because of sand addition (Fig. 7b). Omrani et al. (2020) reported that their samples of clay and sand without fibers showed similar behavior.
 |
Fig. 7 Specimen shapes after failure under the uniaxial compression test: (a) control sample (C-304) and (b) sample C-304 S 25%. |
3.2 XRD characterization
The XRD patterns show the diffractograms of the different samples that were analyzed; they are the control sample (C-304), C-304 S 15%, C-304 S 25%, sieved ferruginous sand, N.M. ferruginous sand, and E.M. ferruginous sand (Fig. 8). For the analysis, microcline and orthoclase were unified in only one phase because their phases are similar. It can be observed that the strongest diffraction peak for all samples, except for E.M. ferruginous sand, came from quartz. The C-304 diffractogram exhibits minerals such as orthoclase/microcline (O), muscovite (M), and quartz (Q). The same mineral phases remained in sample C-304 S 15%, which also had a slight peak for magnetite (N) and a stronger peak for aragonite (A). For C-304, the 25% magnetite (N) peak was stronger, and a slight peak appeared for ilmenite (I) and labradorite (L).
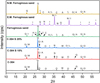 |
Fig. 8 XRD patterns of C-304, C-304 S 15%, C-304 S 25%, and ferruginous sand, N.M. ferruginous sand, and E.M. ferruginous sand. The nomenclature for the mineral phases is as follows: quartz (Q), orthoclase/microcline (O), muscovite (M), aragonite (A), magnetite (N), ilmenite (I), labradorite (L), and calcite (C). |
Regarding N.M. ferruginous sand, quartz remained. Small peaks can be observed for calcite (C) and aragonite (A). Another peak attributed to labradorite (L) is shown with a stronger intensity than the other phases. In contrast, E.M. ferruginous sand showed the highest peak for magnetite and ilmenite (N, I) and medium-sized peaks for quartz (Q). The components that exhibited a percentage lower than 5% are not labeled in Figure 8.
The quantitative and qualitative analysis results are shown in Table 2. Because the clay did not have a previous purification treatment, it was evidenced that it contains many minerals. It can be observed that for C-304, the main mineral phases were quartz, orthoclase/microcline, and muscovite, as shown in Figure 8. Lower contents of mineral phases, such as albite, kaolinite, guidottiite, hematite, and brookite, were also detected. The addition of 15 wt.% ferruginous sand led to identifying minor amounts of magnetite, ilmenite, calcite, aragonite, labradorite, and anorthite.
Qualitative and quantitative analysis results of C-304, C-304 S 15%, C-304 S 25%, N.M. ferruginous sand, and E.M. ferruginous sand.
Regarding C-304 S 25%, the metallic oxide contents increased at a low percentage; however, the orthoclase/microcline, muscovite, kaolinite, and albite contents decreased since their minerals came from clay. In contrast, the quartz content remained almost constant for all the samples, except for M.E. ferruginous sand. Concerning the N.M. ferruginous sand, the nonmagnetic mineral phases shown in Figure 8 were quartz, aragonite, labradorite, and calcite; among them, there was less calcite. On the other hand, iron and ilmenite oxides were detected, and the ilmenite content represented more than half of the magnetically separated sample. The contents of metallic oxides in the sieved ferruginous sand were low compared to the other mineral phases.
4 Conclusion and perspectives
In this study, free-fall drop impact and uniaxial compression tests were performed with a novel material prepared from Ecuadorian raw materials for CO2 capture. The samples subjected to the mechanical test possessed sand contents of 0 (control sample), 15, and 25 wt.%. Concerning the free-fall drop impact, the control samples under wet and dry conditions presented a drop number of 10. In contrast to the control sample, the pellets with sand contents under wet and dry conditions decreased the drop number to 4, except for C-304 S 15%, which had a drop number of 5. It can be concluded that the presence of water in calcined pellets does not affect the drop number, in contrast to the presence of sand. The data calculated from the uniaxial compression test suggested that samples with 15 wt.% sand contents possessed higher values for compressive strength than the control sample owing to their lower porosity. The elastic modulus showed the highest value for the sample with 25 wt.% sand contents; however, the control sample and C-304 S 15 wt.% showed similar values. The toughness values were lower and did not vary significantly. Moistened samples showed the lowest values under all conditions, possibly evidenced by the hydraulic forces generated in the pores under compressive stresses. Therefore, it was proven that the porosity, mineral composition, and humidity affect the mechanical properties in the uniaxial compression test. After the sample fracture, the specimen showed brittle behavior due to the formation of longitudinal cracks. These results revealed that this material possesses suitable mechanical properties under all tested conditions for handling.
The XRD results showed that the amounts of aragonite, labradorite, iron, and titanium oxides increase at higher sand contents. The E.M. ferruginous sand presented higher values than the other samples for magnetite and ilmenite. An important characteristic of the material is the clay, which serves as a binder and does not need a purification process, making it an inexpensive binder material for industrial applications. In addition, the high contents of iron and titanium oxides in ferruginous sand indicate that it is a potential material for CO2 capture processes.
Subsequent studies of CO2 capture in systems at high pressures and high temperatures will be performed using the solids characterized in this study to determine their CO2 adsorption capacity and identify potential industrial applications of the CO2 capture process using clay/sand pellets. Additionally, strategies including impregnation with amines or the inclusion of vegetable fibers and thermal regeneration of pellets will be examined to improve the CO2 absorption process.
Funding sources
This work was carried out within the framework of the project “Ferruginous and titaniferous sands of Ecuador as adsorbents of acid gases in the hydrocarbon industry” financed by SENESCYT (Ecuador).
Acknowledgments
The authors would like to thank Professor Jorge Toro, Ph.D., for his outstanding support during the sampling campaigns.
References
- Abatzoglou N., Boivin S. (2009) A review of biogas purification processes, Biofuels Bioprod. Biorefin. 3, 42–71. https://doi.org/10.1002/bbb.117. [Google Scholar]
- Al Bahri M., Calvo L., Gilarranz M., Rodriguez J. (2012) Activated carbon from grape seeds upon chemical activation with phosphoric acid: Application to the adsorption of diuron from water, Chem. Eng. J. 203, 348–356. https://doi.org/10.1016/j.cej.2012.07.053. [Google Scholar]
- Arencibia A., Pizarro P., Sanz R., Serrano D. (2019) Microporous and mesoporous materials CO2 adsorption on amine-functionalized clays, Micropor. Mesopor. Mater. 282, 38–47. https://doi.org/10.1016/j.micromeso.2019.03.012. [Google Scholar]
- Asmani M., Kermel C., Leriche A., Ourak M. (2001) Influence of porosity on Young’s modulus and Poisson’s ratio in alumina ceramics, J. Eur. Ceram. Soc. 21, 1081–1086. https://doi.org/10.1016/S0955-2219(00)00314-9. [Google Scholar]
- Baltrusaitis J., Schuttlefield J., Zeitler E., Jensen J., Grassian V. (2007) Surface reactions of carbon dioxide at the adsorbed water – oxide interface, J. Phys. Chem. C 111, 14870–14880. https://doi.org/10.1021/jp074677l. [Google Scholar]
- Cavalcanti P., de Carvalho R., das Chagas A., da Silveira M., Tavares L. (2018) Surface breakage of fired iron ore pellets by impact, Powder Technol. 342, 735–743. https://doi.org/10.1016/j.powtec.2018.10.044. [Google Scholar]
- Cecilia J., Vilarrasa-García E., Cavalcante C., Azevedo D., Franco F., Rodríguez-Castellón E. (2018) Evaluation of two fibrous clay minerals (sepiolite and palygorskite) for CO2 capture, J. Environ. Chem. Eng. 6, 4573–4587. https://doi.org/10.1016/j.jece.2018.07.001. [Google Scholar]
- Chen Y., Lu D. (2015) CO2 capture by kaolinite and its adsorption mechanism, Appl. Clay Sci. 104, 221–228. https://doi.org/10.1016/j.clay.2014.11.036. [Google Scholar]
- Choi S., Drese J., Jones C. (2009) Adsorbent materials for carbon dioxide capture from large anthropogenic point sources, ChemSusChem 2, 796–854. https://doi.org/10.1002/cssc.200900036. [CrossRef] [PubMed] [Google Scholar]
- Chouikhi N., Cecilia J., Vilarrasa-García E., Besghaier S., Chlendi M., Franco F., Rodriguez E., Bagane M. (2019) CO2 adsorption of materials synthesized from clay minerals: A review, Minerals 9, 514. https://doi.org/10.3390/min9090514. [Google Scholar]
- Creamer A., Gao B. (2016) Carbon based adsorbent for combustion CO2 capture: A critical review, Environ. Sci. Technol. 50, 7276–7289. https://doi.org/10.1021/acs.est.6b00627. [Google Scholar]
- Erguler Z., Ulusay R. (2009) Water-induced variations in mechanical properties of clay-bearing rocks, Int. J. Rock Mech. Min. Sci. 46, 355–370. https://doi.org/10.1016/j.ijrmms.2008.07.002. [Google Scholar]
- Garba Z., Galadima A. (2020) Carbon capture and storage (CCS) technology: Challenges to implementation, in: Encyclopedia of Renewable and Sustainable Materials, Vol. 3, Elsevier, pp. 291–299. https://doi.org/10.1016/B978-0-12-803581-8.11002-1. [Google Scholar]
- Garshasbi V., Jahangiri M., Anbia M. (2017) Equilibrium CO2 adsorption on zeolite 13X prepared from natural clays, Appl. Surf. Sci. 393, 225–233. https://doi.org/10.1016/j.apsusc.2016.09.161. [Google Scholar]
- Ghanbari T., Abnisa F., Ashri W. (2020) A review on production of metal-organic frameworks (MOF) for CO2 adsorption, Sci. Total Environ. 707, 135090. https://doi.org/10.1016/j.scitotenv.2019.135090. [Google Scholar]
- Goméz-Pozuelo G., Sanz-Peréz E., Arencibia A., Pizarro P., Sanz R., Serrano D. (2019) CO2 adsorption on amine-functionalized clays, Micropor. Mesopor. Mater. 282, 38–47. https://doi.org/10.1016/j.micromeso.2019.03.012. [Google Scholar]
- González J., Román S., González-García C., Valente J., Ortiz L. (2009) Porosity development in activated carbons prepared from walnut shells by carbon dioxide or steam activation, Ind. Eng. Chem. Res. 48, 7474–7481. https://doi.org/10.1021/ie801848x. [Google Scholar]
- Gul A., Sirkeci A., Boylu F., Guldan G., Burat F. (2014) Improvement of mechanical strength of iron ore pellets using raw and activated bentonites as binders, Physicochem. Probl. Miner. Process. 51, 23–36. https://doi.org/10.5277/ppmp150203. [Google Scholar]
- Guo Y., Li C., Lu S., Zhao C. (2015) K2CO3 modified potassium feldspar for CO2 capture from post-combustion flue gas, Energy Fuels 29, 8151–8156. https://doi.org/10.1021/acs.energyfuels.5b02207. [Google Scholar]
- Hakim A., Marliza T., Tahari N., Isahak R., Yusop R., Hisham W., Yarmo A. (2016) Studies on CO2 adsorption and desorption properties from various type iron oxides, Ind. Eng. Chem. Res. 55, 7888–7897. https://doi.org/10.1021/acs.iecr.5b04091. [Google Scholar]
- Howarth D., Rowlands J. (1986) Development of an index to quantify rock texture for qualitative assessment of intact rock properties, Geotech. Test. J. 9, 69–79. https://doi.org/10.1520/GTJ10627J. [Google Scholar]
- Hu P., Zhang S., Wang H., Pan D., Tian J., Tang Z., Volinsky A. (2011) Heat treatment effects on Fe3O4 nanoparticles structure and magnetic properties prepared by carbothermal reduction, J. Alloys Compd. 509, 2316–2319. https://doi.org/10.1016/j.jallcom.2010.10.211. [Google Scholar]
- International Energy Agency (2017) CO2 emissions from fuel combustion 2017, IEA Publications. ISBN: 978-92-64-27819-6. https://doi.org/10.1787/22199446. [Google Scholar]
- Kawatra S., Ripke S. (2002) Pelletizing steel mill desulfurization slag, Int. J. Miner. Process. 65, 165–175. https://doi.org/10.1016/S0301-7516(01)00073-4. [Google Scholar]
- Komadel P., Madejová J. (2013) Acid activation of clay minerals, Dev. Clay Sci. 5, 385–409. Elsevier. https://doi.org/10.1016/B978-0-08-098258-8.00013-4. [Google Scholar]
- Kuruppu M., Chong K. (2012) Fracture toughness testing of brittle materials using a Semi-Circular Bend (SCB) specimen, Eng. Fract. Mech. 91, 133–150. https://doi.org/10.1016/j.engfracmech.2012.01.013. [Google Scholar]
- Lagos K., Marinkovic B., Dosen A., Guamán M., Guerrero V., Pardo E., Pontón P. (2020) Data on phase and chemical compositions of black sands from “El Ostional” beach situated in Mompiche, Ecuador, Data Brief 32, 106214. https://doi.org/10.1016/j.dib.2020.106214. [Google Scholar]
- Omrani H., Hassini L., Benazzouk A., Beji H., ELcafsi A., (2020) Elaboration and characterization of clay-sand composite based on Juncus acutus fibers, Constr. Build. Mater. 238, 117712. https://doi.org/10.1016/j.conbuildmat.2019.117712. [Google Scholar]
- Pham T., Lee B., Kim J., Lee C. (2016) Enhancement of CO2 capture by using synthesized nano-zeolite, J. Taiwan Inst. Chem. Eng. 64, 220–226. https://doi.org/10.1016/j.jtice.2016.04.026. [Google Scholar]
- Rao N., Wang M., Shang Z., Hou Y., Fan G., Li J. (2017) CO2 adsorption by amine-functionalized MCM-41: A comparison between impregnation and grafting modification methods, Energy Fuels 32, 670–677. https://doi.org/10.1021/acs.energyfuels.7b02906. [Google Scholar]
- Samanta A., Zhao A., Shimizu G., Sarkar P., Gupta R. (2012) Post-combustion CO2 capture using solid sorbents: A review, Ind. Eng. Chem. Res. 51, 1438–1463. https://doi.org/10.1021/ie200686q. [CrossRef] [Google Scholar]
- Schöpfer M., Abe S., Childs C., Walsh J. (2009) The impact of porosity and crack density on the elasticity, strength and friction of cohesive granular materials: Insights from DEM modelling, Int. J. Rock Mech. Min. Sci. 46, 250–261. https://doi.org/10.1016/j.ijrmms.2008.03.009. [Google Scholar]
- Sifat N., Haseli Y. (2019) A critical review of CO2 capture technologies and prospects for clean power generation, Energies 12, 4143. https://doi.org/10.3390/en12214143. [CrossRef] [Google Scholar]
- Sivrikaya O., Arol A. (2013) An investigation of the relationship between compressive strength and dust generation potential of magnetite pellets, Int. J. Min. Process. 123, 158–164. https://doi.org/10.1016/j.minpro.2013.06.006. [CrossRef] [Google Scholar]
- Sousa L. (2013) The influence of the characteristics of quartz and mineral deterioration on the strength of granitic dimensional stones, Env. Earth Sci. 69, 1333–1346. https://doi.org/10.1007/s12665-012-2036-x. [CrossRef] [Google Scholar]
- Tavares L., de Almeida R. (2020) Breakage of green iron ore pellets, Powder Technol. 366, 497–507. https://doi.org/10.1016/j.powtec.2020.02.074. [CrossRef] [Google Scholar]
- Zeleňák V., Badaničová M., Halamová D., Čejka J., Zukal A., Murafa N., Goerigk G. (2008) Amine-modified ordered mesoporous silica: Effect of pore size on carbon dioxide capture, Chem. Eng. J. 144, 336–342. https://doi.org/10.1016/j.cej.2008.07.025. [CrossRef] [Google Scholar]
- Zhang S., Chen C., Ahn W. (2019) Recent progress on CO2 capture using amine-functionalized silica, Curr. Opin. Green Sustain. Chem. 16, 26–32. https://doi.org/10.1016/j.cogsc.2018.11.011. [CrossRef] [Google Scholar]
- Zhao Y., Cao Y., Zhong Q. (2014) CO2 capture on metal-organic framework and gra-phene oxide composite using a high-pressure static adsorption apparatus, J. Clean Energy Technol. 2, 34–37. https://doi.org/10.7763/JOCET.2014.V2.86. [CrossRef] [Google Scholar]
All Tables
Qualitative and quantitative analysis results of C-304, C-304 S 15%, C-304 S 25%, N.M. ferruginous sand, and E.M. ferruginous sand.
All Figures
|
Fig. 1 Experimental procedure used in this work. |
| In the text | |
|
Fig. 2 Drop number as a function of sand contents in pellets under dry and wet conditions. |
| In the text | |
|
Fig. 3 Compressive strength of the specimens: (a) dry and wet control samples and (b) specimens with sand contents under different conditions: sand that has not been sieved (R), sieved sand (S), and wet conditions (W). |
| In the text | |
|
Fig. 4 Crushing force of the specimens: (a) dry and wet control samples and (b) specimens with sand contents under different conditions: sand that has not been sieved (R), sieved sand (S), and wet conditions (W). |
| In the text | |
|
Fig. 5 Elastic modulus of the specimens: (a) dry and wet control samples and (b) specimens with sand contents under different conditions: sand that has not been sieved (R), sieved sand (S), and wet conditions (W). |
| In the text | |
|
Fig. 6 Toughness of the specimens: (a) dry and wet control samples and (b) specimens with sand contents under different conditions: sand that has not been sieved (R), sieved sand (S), and wet conditions (W). |
| In the text | |
|
Fig. 7 Specimen shapes after failure under the uniaxial compression test: (a) control sample (C-304) and (b) sample C-304 S 25%. |
| In the text | |
|
Fig. 8 XRD patterns of C-304, C-304 S 15%, C-304 S 25%, and ferruginous sand, N.M. ferruginous sand, and E.M. ferruginous sand. The nomenclature for the mineral phases is as follows: quartz (Q), orthoclase/microcline (O), muscovite (M), aragonite (A), magnetite (N), ilmenite (I), labradorite (L), and calcite (C). |
| In the text | |