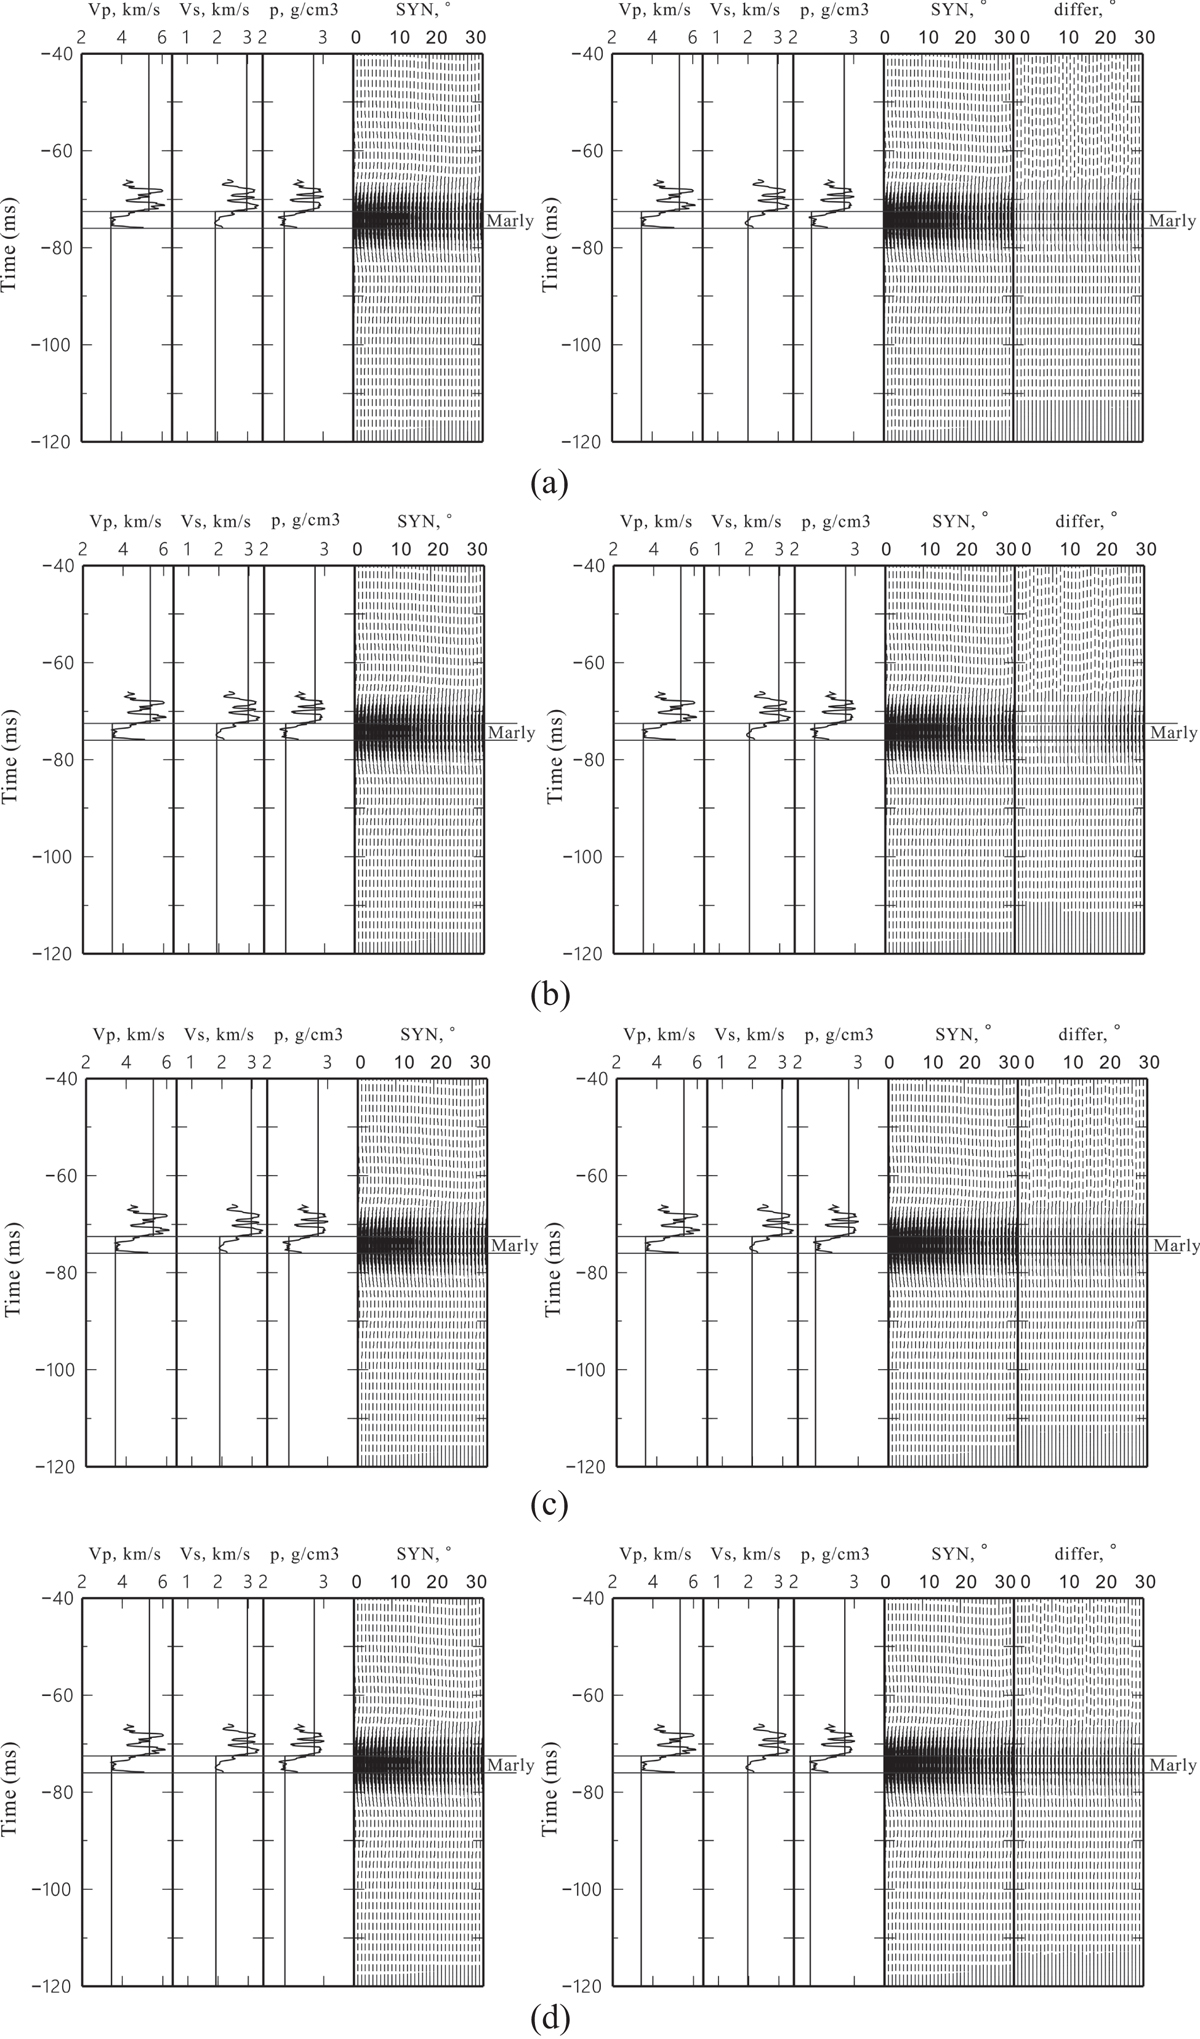
Fig. 13
Download original image
Two-layer models. The figures on the left show the P-wave velocity, S-wave velocity, density, and synthetic seismogram from left to right, whereas the figures on the right show the P-wave velocity, S-wave velocity, density, synthetic seismogram and difference between the synthetic seismograms. In the plots of the P-wave velocity, S-wave velocity and density, the curves are measured well log data, and the straight lines are block parameters. In each row, the difference between the synthetic seismograms on the left and right is shown on the far right. The conditions of the plots on the left and right of each row are as follows: a) Left: 15 MPa pore pressure, 0.2 porosity, and 5% CO2 saturation; right: 8 MPa pore pressure, 0.2 porosity, and 20% CO2 saturation; b) Left: 15 MPa pore pressure, 0.2 porosity, and 5% CO2 saturation; right: 8 MPa pore pressure, 0.21 porosity, and 20% CO2 saturation; c) Left: 15 MPa pore pressure, 0.2 porosity, and 5% CO2 saturation; right: 8 MPa pore pressure, 0.22 porosity, and 20% CO2 saturation; d) Left: 15 MPa pore pressure, 0.2 porosity, and 5% CO2 saturation; right: 8 MPa pore pressure, 0.23 porosity, and 20% CO2 saturation.