Figure 1
Download original image
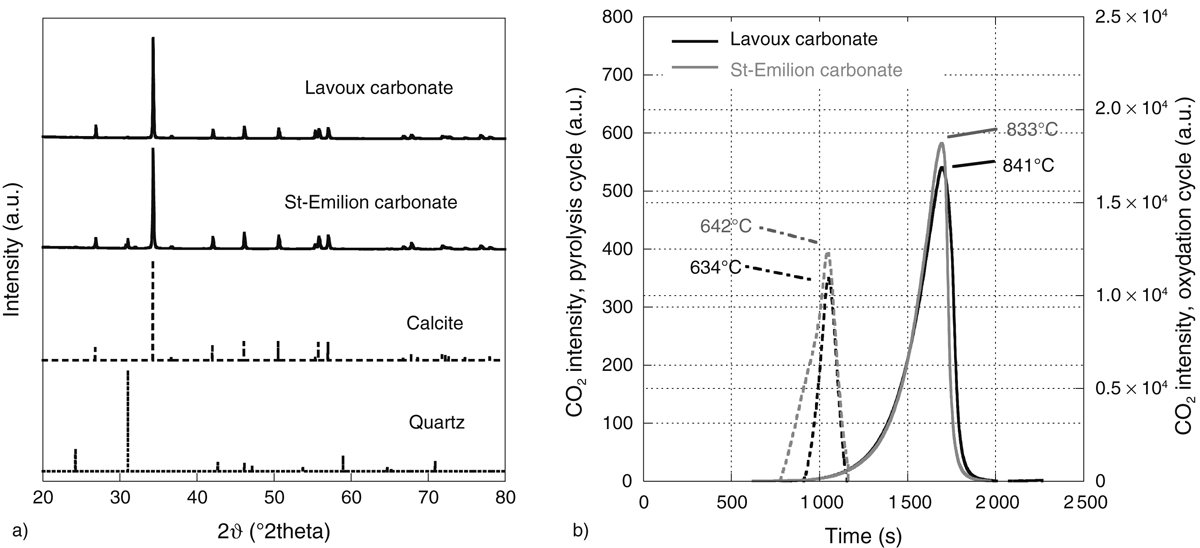
a) Plots of the Lavoux and the St-Emilion natural carbonates XRD analysis and those of pure calcite and quartz. Diffractograms are normalized with respect to their highest peak. b) Comparative Rock-Eval 6 analysis of the Lavoux and the St-Emilion carbonates. Dotted lines represent the pyrolysis cycle (intensity scale on the left axis) whereas full lines represent the oxidation cycle (intensity scale on the right axis).