Regular Article
Formation damage due to asphaltene precipitation during CO2 flooding processes with NMR technique
1
State Key Lab of Oil and Gas Resources and Engineering, China University of Petroleum-Beijing, Beijing 102249, People’s Republic of China
2
Research Institute of Petroleum Exploration and Development, CNPC, Beijing 100083, People’s Republic of China
* Corresponding author: This email address is being protected from spambots. You need JavaScript enabled to view it.
Received:
17
July
2018
Accepted:
5
November
2018
Abstract
In order to quantitatively evaluate the pore-scale formation damage of tight sandstones caused by asphaltene precipitation during CO2 flooding, the coreflood tests and Nuclear Magnetic Resonance (NMR) relaxometry measurements have been designed and applied. Five CO2 coreflood tests at immiscible, near-miscible and miscible conditions were conducted and the characteristics of the produced oil and gas were analyzed. For each coreflood test, the T2 spectrum of the core sample was measured and compared before and after CO2 flooding to determine the asphaltene precipitation distribution in pores. It is found that, the solubility and extraction effect of the CO2 plays a more dominant role in the CO2-EOR (Enhanced Oil Recovery) process with higher injection pressure. And, more light components are extracted and recovered by the CO2 and more heavy components including asphaltene are left in the core sample. Thus, the severity of formation damage influenced by asphaltene precipitation increases as the injection pressure increases. In comparison to micro and small pores (0.1–10 ms), the asphaltene precipitation has a greater influence on the medium and large pores (10–1000 ms) due to the sufficient interaction between the CO2 and crude oil in the medium and large pores. Furthermore, the asphaltene precipitation not only causes pore clogging, but also induces rock wettability to alter towards oil-wet direction.
© K. Qian et al., published by IFP Energies nouvelles, 2019
 This is an Open Access article distributed under the terms of the Creative Commons Attribution License (http://creativecommons.org/licenses/by/4.0), which permits unrestricted use, distribution, and reproduction in any medium, provided the original work is properly cited.
1 Introduction
CO2 flooding has been proven to be an effective technique to Enhanced Oil Recovery (EOR) through both laboratory experiments and field application for several decades [1–3]. The injected CO2 could interact with crude oil in the reservoirs, leading to significant effects on EOR. The main mechanisms of CO2-EOR technique include oil-swelling effect, viscosity reduction, light-hydrocarbon extraction and interfacial tension reduction [4]. However, it has been reported that the interaction between CO2 and crude oil is the determine factor for asphaltene precipitation. For example, in Midale in Canada, no prior asphaltene problem was encountered until CO2 injection. Asphaltene precipitation also occurred in other CO2 floods, such as in Little Creek Field, Mississippi and West Texas [5].
Asphaltene precipitation could cause serious damages to formations [5–7]. This is because the precipitated asphaltene will deposit on to the reservoir rocks, which may cause reservoir plugging and wettability alteration [8, 9]. To investigate asphaltene precipitation during CO2 flooding processes, extensive coreflood experimental studies have been conducted. Wang et al. [10] found that the degree of permeability reduction is positively correlated with the percentage of asphaltene precipitated through CO2 core flooding tests. Cao and Gu [11] demonstrated that less amount of asphaltene remained in the cores in immiscible conditions while more asphaltene precipitation is observed under miscible conditions. Wang et al. [12] found that permeability reduction due to asphaltene precipitation mainly occurs in the middle and tail end of the reservoir in the miscible CO2 Water-Alternating-Gas (WAG) injection after the continuous CO2 injection through long coreflood experiments. Moreover, the wettability alteration also occurs due to asphaltene precipitation, which has negative influence on the formation. Amroun and Tiab [13] and Escrochi et al. [14] reported that the asphaltene precipitation was the main platform for wettability alteration and the porous media changed towards strongly oil-wet condition. Uetani [15] reported that the productivity dropped immediately and water cut increased from 2–3% to 10–15% in field “M”, which was caused by the rock wettability altered form water-wet to oil-wet because of asphaltene precipitation.
Although, the asphaltene precipitation during CO2 flooding could be determined through the measurement of permeability reduction combined with the asphaltene content of the produced oil [16, 17]. The pore-scale distribution of asphaltene deposition has been rarely investigated. Srivastava et al. [18] used X-ray CAT (Computer Aided Tomography)-scanning technique to visualize the asphaltene deposition along the length of the core. Song et al. [19] made a microscopic model to observe the distribution of asphaltene deposition in 2-D porous networks. However, these methods can only qualitatively observe the distribution of asphaltene precipitation, and the influence of asphaltene precipitation on the pores cannot be quantitatively evaluated. In order to quantitatively analyze the distribution of asphaltene precipitation in pores, Wang et al. [10] applied Nuclear Magnetic Resonance (NMR) to scan tight artificial cores before and after CO2 flooding. Besides determining the distribution of asphaltene precipitation, NMR technique is a powerful tool for non-invasively analyzing the wetting state of rock [20, 21]. Shikhov et al. [22] studied the wettability change of sandstone cores over aging time with low-field NMR measurements.
In this study, an analysis method reference to Amott method [23] was proposed to quantitatively evaluate the wettability alteration before and after CO2 flooding combined with determining the distribution of asphaltene precipitation. First, in order to determine the influence of CO2-brine-rock interaction on the core samples, two core samples saturated with kerosene which does not contain asphaltene were applied to conduct CO2 coreflood experiments. Then, five CO2 coreflood tests were conducted at different injection pressures. The oil recovery factors, the viscosity and the asphaltene contents of the produced oil were measured during these tests. Then, through comparing the difference in the NMR transverse relaxation time (T2) spectrum for the water-saturated cores before and after CO2 flooding, the distribution of asphaltene precipitation in the pores and throats of core samples was quantitatively evaluated. At the same time, the wettability alteration condition was evaluated by calculating the condition of oil saturation in pores before and after CO2 flooding. On these bases, this study can help to improve the system of quantitatively evaluating the distribution of the asphaltene precipitation and wettability alteration in pores and throats.
2 Experimental section
2.1 Materials
In this study, the Stock Tank Oil (STO) sample was collected from Changqing Oilfield, China. The density and viscosity of the cleaned STO were measured to be 833.4 kg/m3 and 4.76 mPa s at the atmospheric pressure and 61 °C and the MWoil = 229.7 g/mol. The asphaltene content of the cleaned crude oil was measured to be 0.94 wt% (n-pentane insoluble) with the standard ASTM D2007-03 method [24]. The wax content was measured by the Thin-Layer Chromatograph/Flame Ionization Detection (TLC-FID) method and the Saturate, Aromatic, Resin and Asphaltene (SARA) analysis of the crude oil was measured with the standard SATM D4124, as shown in Table 1. The density and viscosity of the kerosene were measured to be 792.0 kg/m3 and 1.01 mPa s at the atmospheric pressure and 61 °C. The Gas Chromatography (GC) compositional analysis of the cleaned crude oil sample and kerosene is given in Table 2.
Wax content and SARA analysis of the crude oil.
Compositional analysis of the crude oil with the asphaltene content of wasp = 0.94 wt% (n-pentane insoluble) and the kerosene without asphaltene.
The reservoir brine sample was collected from the same formation and cleaned. The reservoir brine has the Total Dissolved Solids (TDS) of 30 917.8 mg/L, which was considered to be the water type of calcium chloride. The brine viscosity was measured to be 0.4 mPa s at the atmospheric pressure and 61 °C. The purity of the CO2 used in this study was equal to 99.99% supplied by Beijing Huayuan Gas Chemical Co. Ltd.
2.2 MMP tests
Figure 1 shows the schematic diagram of the slim-tube apparatus (CFS-100, Core Lab, Tulsa, OK, USA) for conducting a series of displacement experiments to determine the Minimum Miscibility Pressure (MMP) of the crude oil – CO2 system in this study. The apparatus was consisted of a displacement pump (260D, ISCO, Lincoln, NE, USA), a stainless steel slim tube packed with silica sands (Shengfa Mining Industry Co. Ltd., China), a back-pressure regulator (Huada, Haian, China) and two pressure transducers to monitor injection pressure and back pressure constantly. A burette was used to collect and measure the produced oil and a gas flow meter to measure the volume of the produced gas.
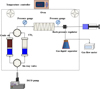 |
Fig. 1 Schematic diagram of the slim-tube test setup. |
In this study, the MMP of the CO2-crude oil system was determined by six slim-tube tests with different injection pressure at the formation temperature of 61 °C. The displacement system was cleaned by petroleum ether and dried by nitrogen several times in preparation of each slim-tube tests. Then, the apparatus was saturated with the crude oil at the reservoir temperature of Tres = 61 °C with a constant flow rate of 0.2 cm3/min and the back pressure should be maintained the desired production pressure in order to prevent the crude oil from degassing. The CO2 was injected into the slim tube to displace the crude oil with a constant flow rate of 0.1 cm3/min at the set injection pressure. The injection and production pressure was continuously monitored and recorded during the entire experiment. The volume of the produced oil and gas was measured at every 0.1 PV of pure CO2 until 1.2 PV CO2 was injected.
2.3 Coreflood tests
Figure 2 depicts the schematic diagram of the high-pressure coreflood apparatus used for CO2 coreflood tests. A constant flow pump (260D, ISCO, Lincoln, NE, USA) was applied to displace dead crude oil, brine and CO2 through the core plug inside a high-pressure stainless steel coreholder (Huada, Haian, China) with the inner diameter and outer diameter of 25 mm and 40 mm. Three high pressure cylinders were applied to store and deliver crude oil, brine and CO2, respectively. Another ISCO syringe pump was used to exert the confining pressure which was always kept 2–3 MPa higher than the injection pressure on the core plug. All above mentioned components were placed inside an air bath which was heated by two electronic heat guns. A temperature controller was used to keep the air bath at the reservoir temperature of 61 °C. A back-pressure regulator (Huada, Haian, China) was used to target the desired production pressure during the coreflood test. A burette was used to collect and measure the produced oil and a gas flow meter to measure the volume of the produced gas.
 |
Fig. 2 Schematic diagram of the high-pressure CO2 coreflood apparatus. |
The core samples used in this experiment are tight cores collected from Changqing Oil Field, China. It is noted that the core samples with nearly the same gas permeability pore size distribution are selected, which are from the same formation. The properties of cores are listed in Table 3.
Basic properties of tight core plug samples.
The general procedure for the CO2 coreflood tests is briefly described as follows:
Prior to each test, the core plugs were thoroughly cleaned by using a Dean−Stark extractor (SXT-02, Shanghai Ping Xuan Scientific Instrument Co., Ltd., China) for 20–30 days. After the core plugs were cleaned and dried at 100 °C. The gas permeability and porosity were measured with nitrogen (High-Pressure Gas Permeameter/Porosimeter, Temco, Tulsa, OK).
The core plug was placed in the high-pressure coreholder and vacuumed for 24 hours. Then the formation brine was injected at the flow rate of 0.2 cm3/min to saturate the core plug. Then, the NMR apparatus was used to measure T2 transverse relaxation time of the core sample under initial water-saturated condition.
The core was displaced with the MnCl2 solution (15 000 mg/L) of 5 PV. And then the saturated core was scanned again by NMR apparatus to make sure the hydrogen signal of the brine eliminated.
After that, 3.0 PV of the crude oil was pumped through the core plugs at a constant rate of 0.1 cm3/min until no water was produced to achieve the connate water saturation (Swc) the initial oil saturation (Soi) at the reservoir temperature of 61 °C. The physical properties of core plugs were listed in Table 3. The T2 spectrum was measured again after the core had been saturated with crude oil.
In each test, 2.0 PV CO2 was pumped into the coreholder to displace the crude oil at the desired injection pressure and reservoir temperature of 61 °C. The injection and production pressure was continuously monitored and recorded during the entire test. The cumulative produced oil volume was recorded by a video camera and the cumulative volume of the produced gas was measured and recorded by using the gas flow meter. The produced oil and gas were collected during each coreflood test and the components of the produced oil and gas were analyzed by GC technique.
After the CO2 coreflood test, the core samples, were cleaned by a Soxhlet Extractor with the solvent of petroleum ether which cannot dissolve asphaltene [25] and dried for 12 h at 100 °C. The gas permeability core samples were measured by permeameter with nitrogen.
The cleaned core sample was conducted the same treatments from step 1 to step 4.
2.4 NMR tests
NMR refers to the response of atomic nuclei to magnetic fields. The NMR apparatus (Mini-MR, Niumag, Suzhou, China) used in this study detects the transverse relaxation motion of 1H of fluids in the pores, which produces a relatively strong signal compared to other elements in earth formations [26]. The magnetic intensity, gradient value control precision and frequency range of the NMR apparatus are 0.5 T, 0.025 T/m, 0.01 MHz and 1–30 MHz, respectively. As for the NMR transverse relaxation time of fluid in the pore is given as [27, 28]: (1)
(1)
T2S: the surface relaxation time (ms);
T2D: the relaxation time as induce by diffusion in magnetic gradients (ms);
T2B: the bulk relaxation time of the pore-filling fluid (ms).
Because T2B is much larger than T2 for fluid in porous media, T2B is usually neglected. T2D is reasonably neglected, when the magnetic field is thought to be uniform with a quite small field gradient and echo time is small enough. Furthermore, T2S is associated with specific surface of a pore. Then, (2)
(2)
ρ2: the surface relaxation rate (um/ms);
S: the interstitial surface area (um2);
V: the pore volume (um3).
S/V can be written as a function of the dimensionless shape factor of a pore, FS, and pore radius, r (um), as follows, (3)
(3)
Combining equations (2) and (3), (4)then,
 (5)
(5) (6)C is considered to be a constant for equations (5) and (6) so the T2 response is proportional to the pore radius. In our work, 0.1–1 ms of T2 is defined as micro pores, 1–10 ms defined as small pores, 10–100 ms defined as medium pores and 100–1000 ms as large pores.
3 Results and discussion
3.1 Experimental identification of CO2/brine/rock interactions with NMR technique
In the CO2 flooding process, the solid precipitation was partly generated due to CO2/bine/rock reactions. The solid precipitation and clay particles would migrate in the pore and possibly cause a blockage in the pore throat [29]. So that, the CO2/bine/rock reactions would induced permeability reduction of the cores [30]. Nevertheless the studies on the permeability reduction due to CO2/bine/rock reactions are basically about aquifers. It is necessary to investigate the influence of the CO2/bine/rock reactions on permeability reduction of oil reservoir formation before the experimental study on the impact of asphaltene precipitation on permeability. Therefore, instead the crude oil, the kerosene without asphaltene was used to conduct the coreflood experiments first.
As shown in Figure 3, the T2 spectrum for the initial water-saturated cores 1–1 and 1–2, and the T2 spectrum for the water-saturated cores after CO2 flooding, were measured. It can been seen from Figures 3a and 3b that the T2 spectrum for the water-saturated core after CO2 flooding did not deviate from the T2 spectrum for the initial water-saturated cores. Thus, in the case of experimental error, the distribution of pores was considered unchanged. The experimental result is different from similar experimental results in other literature that the CO2/bine/rock reactions occur and change the pore structure in the cores during CO2 coreflood tests [31, 32]. That is because that the reaction time of these coreflood tests is too short in comparison with experiments in other literature. Therefore, the CO2/bine/rock reactions are considered to have no influence on the pore distribution of the sandstone cores saturated with oil during the CO2 flooding process.
 |
Fig. 3 Comparison of T2 spectrum for the initial water-saturated cores and for the water saturated cores after CO2 flooding and cleaning. |
3.2 CO2-oil MMP
In this study, the slim-tube tests at six different injection pressures under a constant reservoir temperature of 61 °C were conducted to determine the MMP of the crude oil sample. The measured Oil Recovery Factors (ORF) versus Pore Volume (PV) of injected were illustrated in Figure 4. As expected, the ORF increased with the injection of CO2 at each injection pressure, and the growth rate of the ORFs decreased rapidly after 0.6 PV of injected CO2 because of the CO2 breakthrough. There was no more oil obtained in each test at 1.2 PV of injected CO2 which was the terminal point. Because the rate of CO2 extraction and dissolution accelerated with the growth of injection pressure [16], leading to stronger swelling effect and lower capillary resistance. The ultimate ORF of each slim-tube test increased as the injection pressure increased. In addition, the ultimate ORF at Pinj = 20 MPa, 23 MPa and 26 MPa have no obvious growth, which indicates that the MMP measured by slim-tube test is between 16 MPa ≤ Pinj ≤ 20 MPa. After that, the ultimate ORFs of each slim-tube test versus injection pressure were depicted in Figure 5 to determine the MMP. Figure 5 shows that the first three points and the last three points are linear respectively. The intersection point of two fitting curves is regarded as the MMP of the CO2-crude oil system measured by slim-tube test, which is 17.02 MPa.
 |
Fig. 4 Oil recovery factors versus volume of the injected CO2 in terms of the PV at injection pressure from 8–26 MPa and a temperature of 61 °C in slim-tube tests. |
 |
Fig. 5 Variation of the cumulative oil recovery factor determined at 1.2 PV of injected CO2 at different injection pressures. |
3.3 Physicochemical characterization of produced fluids
Figure 6 shows the measured ORF versus PV of injected CO2 at different injection pressures of five coreflood tests under the reservoir temperature of 61 °C. As expected, the ORF increased with the injection of the CO2 until no more oil was produced at 2.0 PV of injected CO2. And, the ORFs increased faster before the injected CO2 of 0.30 PV, 0.55 PV, 0.85 PV, 1.00 PV and 1.10 PV corresponding to the injection pressure of Pinj = 9.1 MPa, 13.5 MPa, 16.2 MPa, 19.5 MPa and 22.1 MPa, respectively. More specifically, the ORF of lower injection pressure was greater than that of higher injection pressure in the initial period of process. Because a less portion of injected CO2 was dissolved into the light crude oil at a lower injection pressure due to the lower solubility and a larger portion of the injected CO2 played a major role in displacement at the same injection rate. With the growth of the injection pressure, the ultimate ORF at the terminal 2.0 PV increased due to the stronger interaction ability between the CO2 and the crude oil.
 |
Fig. 6 Oil recovery factors versus PV of the injected CO2 at different injection pressures. |
Figure 7 shows the oil recovery, asphaltene content and viscosity of the produced oil for five coreflood tests at different injection pressures. The oil recovery factor increased significantly with the increasing injection pressure until reaching the MMP = 17.02 MPa. This is because the viscosity of the crude oil and the InterFacial Tension (IFT) between the crude oil and CO2 decreased at higher injection pressure [11]. In addition, it can been seen from Figure 7 that the viscosity of the produced oil decreased from 10.18 mPa s to 3.72 mPa s when the injection pressure increased from 9.1 MPa to 22.1 MPa. And, the asphaltene content of the produced oil decreased from 0.78 wt% to 0.58 wt% as the injection pressure increasing from 9.1 MPa to 16.2 MPa, while the asphaltent content barely changed when the injection was higher than the MMP (Fig. 7). The aphaltene content of the original oil is 0.94 wt%, which is always higher than that of the produced oil. This result means there is asphaltene precipitation left in the core during CO2 coreflood process. The higher is the asphaltene content of the produced oil, the more is asphaltene left in the core sample.
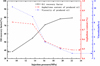 |
Fig. 7 Oil recovery factor, asphaltene content of CO2-pruduced oil and viscosity of produced oil versus the injection pressure of each coreflood test at the temperature of 61 °C. |
3.4 Effect of asphaltene precipitation during CO2 flooding
3.4.1 The effect of asphaltene precipitation on permeability
In this study, the percentage of permeability reduction was obtained by comparing the gas permeability of the core before and after CO2 flooding, as in the following equation: (7)
(7)
Pr: the permeability reduction percentage of the core sample, %;
Kgb: the gas permeability of the core sample before CO2 flooding, mD;
Kga: the gas permeability of the core sample after CO2 flooding, mD.
Figure 8 plots the percentage of permeability reduction of the core samples and asphaltene content of the produced oil at different injection pressures. The asphaltene left in the pores could be inferred from the content of the produced oil. If the asphaltene content of the produced oil was higher, it indicated that there was less asphaltene precipitation in the pores of core sample. It can be seen from Figure 8 that the asphaltene content of the produced oil decreased with the increased injection pressure. But, when the injection pressure approached the MMP, the asphaltene content was almost unchanged.
 |
Fig. 8 The percentage of permeability reduction of the core samples and asphaltene content of the produced oil at different injection pressures. |
Similarly, the percentage of permeability reduction significantly increased from 2.4% to 7.41% as the injection pressure increased in the immiscible stage from 9.1 MPa to 16.2 MPa. When the injection pressure reached the MMP, the percentage of permeability reduction still increased with the injection pressure increasing, but changed slowly compared with that in the immiscible stage. The results were consisted with the asphaltene content of the produced oil at different injection pressures. As a result, more asphaltene would precipitate and block the pores with increasing pressure until the injection pressure reached the MMP.
3.4.2 The effect of asphaltene precipitation on pore structure
As mentioned in the coreflood experimental procedure, the T2 spectrum for the initial water-saturated cores and the T2 spectrum for the water-saturated cores after CO2 flooding were measured and compared. Figure 9 illustrates the T2 spectrum distributions for cores 2–1, 2–3 and 2–5. The NMR spectrum of the core samples was typical bimodal distribution as shown in Figures 3 and 9. It could be seen from Figure 9 that the T2 spectrum measured for the water-saturated core after CO2 flooding moved a slightly lower position compared to that measured for the initial water-saturated core. Because the petroleum ether was used to clean the cores after CO2 flooding and asphaltene cannot dissolve in the petroleum ether [12]. The reduced amplitude of the T2 spectrum indicated the pores were clogged due to the asphaltene precipitation and deposition, which could not be saturated with water. The initial water saturated in the pores and the water saturated in the pores after CO2 flooding is defined as Swb and Swa respectively, the severity of formation damage due to asphaltene precipitation could be calculated as follows: (8)
(8)
Dw: the severity of formation damage due to asphaltene precipitation;
Swb: the summation of the water saturated in the pores of the core before CO2 flooding;
Swa: the summation of the water saturated in the pores of the core after CO2 flooding.
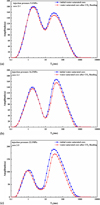 |
Fig. 9 Comparison of T2 spectrum for the initial water-saturated cores and for the water saturated cores after CO2 flooding and cleaning. |
The severity of formation damage due to asphaltene precipitation of the cores 2–1, 2–3 and 2–5 was 3.67%, 8.20% and 13.75%, respectively. And the permeability reduction corresponding to the three cores was 2.4%, 7.41%, 8.32%. The severity of formation damage due to asphaltene precipitation increased as the injection pressure increased. Moreover, the pore distribution influenced by asphaltene precipitation expanded in the miscible stage (Fig. 9). Because CO2 could expand sweep area and enter smaller pores to interact with the crude oil at higher injection pressure.
The amplitude variation of the micro (0.1–1 ms) and small pores (1–10 ms) was smaller than the amplitude variation of the medium (10–100 ms) and large pores (100–1000 ms). That indicated that the asphaltene precipitation had a greater influence on the medium and large pores. The interaction between the CO2 and crude oil in the medium and large pores was sufficient, so that the asphaltene precipitation in the medium and large pores was more serious than micro and small pores (Fig. 9). When the asphaltene precipitated in the tight sandstone reservoirs, the larger particles could block up the pore throat directly [33], while the smaller ones could cause an obstacle or blockage in the pore or pore throat [8]. On the other hand, although part of the micro and small cores were blocked by precipitated asphaltene particles, the medium and large pore radius decreased due to asphaltene precipitation. The medium and large pores transformed into the micro and small pores. Thus, the amplitude of micro and small cores changed little.
Table 4 shows the T2 spectrum distribution which corresponds to pore distribution for the three core samples. The proportion of medium and large pores of the cores after CO2 flooding decreased while the proportion of micro and small pores increased, compared to the initial water-saturated cores. The pore distribution of tight cores after CO2 flooding overall changed to the direction of pore radius reduction after CO2 flooding. Moreover, the proportion changed more greatly at higher injection pressure.
T2 spectrum distribution obtained from NMR tests for the three core samples.
3.4.3 The effect of asphaltene precipitation on wettability
In consistent with the variation of T2 spectrum in Figure 9 due to the asphaltene precipitation, the T2 spectrum measured for oil saturated core after CO2 flooding also deviated slightly lower from that for initial oil-saturated core, as shown in Figure 10. The amount of saturated oil decreased more in medium and large pores (10–1000 ms) than in micro and small pores (0.1–10 ms), as well. However, compared with the difference between the initial water-saturated cores and the water-saturated cores after CO2 flooding (Fig. 9), the difference between the initial oil saturated in pores and the oil saturated in the pores after CO2 flooding is smaller (Fig. 10).
 |
Fig. 10 Comparison of T2 spectrum for the initial oil-saturated cores and for the oil saturated cores after CO2 flooding and cleaning. |
Sob and Soa respectively stands for the initial oil saturated in the pores and the oil saturated in the pores after CO2 flooding. The relative variation of the T2 spectrum in Figure 10 due to asphaltene precipitation could be calculated as follows: (9)
(9) (10)
(10)
Do: the relative variation of the T2 spectrum due to asphaltene precipitation;
Sob: the summation of the oil saturated in the pores of the core before CO2 flooding;
Soa: the summation of the oil saturated in the pores of the core after CO2 flooding;
IWA: the wettability alteration index of the core before and after CO2 flooding.
The pores occupied by asphaltene deposition are constant, so that the Do should have been same as the Dw, theoretically. However, the Do is less than the Dw, which means that some pores could be saturated more oil than water after the CO2 flooding compared with that before CO2 flooding, relatively. The wettability alteration was assumed to occur due to asphaltene precipitation. The wettability of the rock after CO2 flooding altered to the oil-wet direction. The index of the wettability alteration can be represented by IWA. When the IWA is zero, there is no wettability alteration. When the IWA is higher than zero, the wettability changes to oil-wet direction and the larger IWA means stronger oil-wet alteration. The IWA of the core samples after CO2 flooding at different pressures are presented in Table 5. Therefore, the reduction of water permeability was caused by pore clogging and wettability alteration. If the CO2-EOR technique is applied, it is necessary to injection chemical inhibitor into the reservoir to reduce the risk of asphaltene precipitation.
The relative variation of the T2 spectrum in condition of water saturation and oil saturation respectively.
4 Conclusion
In this paper, five CO2 coreflood tests were conducted at immiscible, near-miscible and miscible conditions. For each test, the ORF, the viscosity and the asphaltene contents of the produced oil were analyzed. Then, the distribution of asphaltene precipitation in the pores and wettability alteration was quantitatively evaluated.
It is found that, the extraction effect of the CO2 played a more dominant role in the CO2-EOR process with higher injection pressure. So that more light components are extracted and recovered by the CO2 and more heavy components including asphaltene were left in the core at higher injection pressure. And, the asphaltene precipitated in the core had little increase in the CO2 miscible flooding stage.
The severity of formation damage influenced by asphaltene precipitation increased with the increasing of injection pressure. And, the asphaltene precipitation had a greater influence on the medium and large pores due to the sufficient interaction between the CO2 and crude oil. Furthermore, the asphaltene precipitation not only caused pore clogging, but also induced rock wettability alteration towards oil-wet direction. If the CO2-EOR technique is applied, it is necessary to injection chemical inhibitor into the reservoir to reduce the risk of asphaltene precipitation.
Acknowledgments
We thank the State Key Lab of Oil and Gas Resources and Engineering at the China University of Petroleum-Beijing (CUPB). This research is supported by the National Science and Technology Major Project of the Ministry of Science and Technology of China (Grant 2016ZX05016-006).
References
- Holm L.W., Josendal V.A. (1974) Mechanisms of oil displacement by carbon dioxide, J. Pet. Technol. 26, 12, 1427–1438. [Google Scholar]
- Rahimi V., Bidarigh M., Bahrami P. (2017) Experimental study and performance investigation of miscible water-alternating-CO2 flooding for enhancing oil recovery in the Sarvak formation, Oil Gas Sci. Technol. - Rev. IFP Energies nouvelles 72, 35. [CrossRef] [Google Scholar]
- Ko S.C.M., Stanton P.M., Stephenson D.J. (1985) Tertiary recovery potential of CO2 flooding in Joffre Viking pool, Alberta, J. Can. Pet. Technol. 24, 1, 36–43. [Google Scholar]
- Mungan N. (1966) Interfacial effects in immiscible liquid-liquid displacement in porous media, Soc. Pet. Eng. J. 6, 3, 247–253. [CrossRef] [Google Scholar]
- Sarma H.K. (2003) Can we ignore asphaltene in a gas injection project for light-oils? SPE International Improved Oil Recovery Conference in Asia Pacific, 20–21 October, Kuala Lumpur, Malaysia, Society of Petroleum Engineers. [Google Scholar]
- Tabzar A., Fathinasab M., Salehi A., Bahrami B., Mohammadi A.H. (2018) Multiphase flow modeling of asphaltene precipitation and deposition, Oil Gas Sci. Technol. - Rev. IFP Energies nouvelles 73, 51. [CrossRef] [Google Scholar]
- Abedini A., Ashoori S., Torabi F. (2011) Reversibility of asphaltene precipitation in porous and non-porous media, Fluid Phase Eq. 308, 1–2, 129–134. [CrossRef] [Google Scholar]
- Hu Y.F., Li S., Liu N., Chu Y.P., Park S.J., Ali Mansoori G., Guo T.M. (2004) Measurement and corresponding states modeling of asphaltene precipitation in Jilin reservoir oils, J. Pet. Sci. Eng. 41, 1–3, 169–182. [Google Scholar]
- Hamouda A.A., Chukwudeme E.A., Mirza D. (2009) Investigating the effect of CO2 flooding on asphaltenic oil recovery and reservoir wettability, Energy Fuels 23, 2, 1118–1127. [Google Scholar]
- Wang C., Li T., Gao H., Zhaoa J., Li H.A. (2017) Effect of asphaltene precipitation on CO2-flooding performance in low-permeability sandstones: A nuclear magnetic resonance study, RSC Adv. 7, 61, 38367–38376. [Google Scholar]
- Cao M., Gu Y. (2013) Oil recovery mechanisms and asphaltene precipitation phenomenon in immiscible and miscible CO2, flooding processes, Fuel 109, 157–166. [CrossRef] [Google Scholar]
- Wang Z., Yang S., Lei H., Yang M., Li L., Yang S. (2017) Oil recovery performance and permeability reduction mechanisms in miscible CO2 water-alternative-gas (WAG) injection after continuous CO2 injection: An experimental investigation and modeling approach, J. Pet. Sci. Eng. 150, 376–385. [Google Scholar]
- Amroun H., Tiab D. (2001) Alteration of reservoir wettability due to asphaltene deposition in Rhourd-Nouss Sud Est Field, Algeria, SPE Rocky Mountain Petroleum Technology Conference, Society of Petroleum Engineers. [Google Scholar]
- Escrochi M., Nabipour M., Ayatollahi S.S., Mehranbod N. (2008) Wettability alteration at elevated temperatures: The consequences of asphaltene precipitation, SPE International Symposium and Exhibition on Formation Damage Control, Society of Petroleum Engineers. [Google Scholar]
- Uetani T. (2014) Wettability alteration by asphaltene deposition: A field example, Abu Dhabi International Petroleum Exhibition and Conference, Society of Petroleum Engineers. [Google Scholar]
- Abedini A., Torabi F. (2014) Oil recovery performance of immiscible and miscible CO2 huff-and-puff processes, Energy Fuels 28, 2, 774–784. [Google Scholar]
- Wang X., Gu Y. (2011) Oil recovery and permeability reduction of a tight sandstone reservoir in immiscible and miscible CO2 flooding processes, Ind. Eng. Chem. Res. 50, 4, 2388–2399. [Google Scholar]
- Srivastava R.K., Huang S.S., Dong M. (1999) Asphaltene deposition during CO2 flooding, SPE Prod. Facil. 14, 4, 235–245. [CrossRef] [Google Scholar]
- Song Z., Zhu W., Wang X., Guo S. (2018) 2-D pore-scale experimental investigations of asphaltene deposition and heavy oil recovery by CO2 flooding, Energy Fuels 32, 3194–3201. [Google Scholar]
- Fleury M., Deflandre F. (2003) Quantitative evaluation of porous media wettability using NMR relaxometry, Magn. Reson. Imag. 21, 3–4, 385–387. [Google Scholar]
- Looyestijn W.J., Hofman J. (2006) Wettability-index determination by nuclear magnetic resonance, SPE Reserv. Evalu. Eng. 9, 2, 146–153. [CrossRef] [Google Scholar]
- Shikhov I., Li R., Arns C.H. (2018) Relaxation and relaxation exchange NMR to characterise asphaltene adsorption and wettability dynamics in siliceous systems, Fuel 220, 692–705. [CrossRef] [Google Scholar]
- Amott E. (1959) Observations relating to the wettability of porous rock, Trans. AIME 216, 156–162. [Google Scholar]
- ASTMD2007-03 (2007) Standard test method for characteristic groups in rubber extender and processing oils and other petroleum-derived oils by the clay-gel absorption chromatographic method, ASTM International, West Conshohocken, PA. [Google Scholar]
- Sheu E.Y. (2002) Petroleum asphaltene properties, characterization, and issues, Energy Fuels 16, 1, 74–82. [Google Scholar]
- Coates G.R., Xiao L., Prammer M.G. (1999) NMR logging: Principles and applications, Halliburton Energy Services, Houston, pp. 8–33. [Google Scholar]
- Loren J.D., Robinson J.D. (1970) Relations between pore size fluid and matrix properties, and NML measurements, Soc. Pet. Eng. J. 10, 3, 268–278. [CrossRef] [Google Scholar]
- Megawati M., Madland M.V., Hiorth A. (2012) Probing pore characteristics of deformed chalk by NMR relaxation, J. Pet. Sci. Eng. 100, 123–130. [Google Scholar]
- Yu Z., Liu L., Yang S., Li S., Yang Y. (2012) An experimental study of CO2–brine–rock interaction at in situ pressure–temperature reservoir conditions, Chem. Geol. 326, 88–101. [Google Scholar]
- Mohamed I.M., Nasr-El-Din H.A. (2012) Formation damage due to CO2 sequestration in deep saline carbonate aquifers, SPE International Symposium and Exhibition on Formation Damage Control, Society of Petroleum Engineers. [Google Scholar]
- Fischer S., Liebscher A., Wandrey M., the CO2 SINK Group (2010) CO2–brine–rock interaction – first results of long-term exposure experiments at in situ P-T conditions of the Ketzin CO2 reservoir, Chemie Erde 70, 155–164. [CrossRef] [Google Scholar]
- Yu M., Liu L., Yang S., Yu Z., Li S., Yang Y., Shi X. (2016) Experimental identification of CO2–oil–brine–rock interactions: Implications for CO2 sequestration after termination of a CO2-EOR project, Appl. Geochem. 75, 137–151. [Google Scholar]
- Mendoza de la Cruz J.L., Argüelles-Vivas F.J., Matías-Pérez V., Durán-Valencia C.A., López-Ramírez S. (2009) Asphaltene-induced precipitation and deposition during pressure depletion on a porous medium: An experimental investigation and modeling approach, Energy Fuels 23, 11, 5611–5625. [Google Scholar]
All Tables
Compositional analysis of the crude oil with the asphaltene content of wasp = 0.94 wt% (n-pentane insoluble) and the kerosene without asphaltene.
The relative variation of the T2 spectrum in condition of water saturation and oil saturation respectively.
All Figures
|
Fig. 1 Schematic diagram of the slim-tube test setup. |
| In the text | |
|
Fig. 2 Schematic diagram of the high-pressure CO2 coreflood apparatus. |
| In the text | |
|
Fig. 3 Comparison of T2 spectrum for the initial water-saturated cores and for the water saturated cores after CO2 flooding and cleaning. |
| In the text | |
|
Fig. 4 Oil recovery factors versus volume of the injected CO2 in terms of the PV at injection pressure from 8–26 MPa and a temperature of 61 °C in slim-tube tests. |
| In the text | |
|
Fig. 5 Variation of the cumulative oil recovery factor determined at 1.2 PV of injected CO2 at different injection pressures. |
| In the text | |
|
Fig. 6 Oil recovery factors versus PV of the injected CO2 at different injection pressures. |
| In the text | |
|
Fig. 7 Oil recovery factor, asphaltene content of CO2-pruduced oil and viscosity of produced oil versus the injection pressure of each coreflood test at the temperature of 61 °C. |
| In the text | |
|
Fig. 8 The percentage of permeability reduction of the core samples and asphaltene content of the produced oil at different injection pressures. |
| In the text | |
|
Fig. 9 Comparison of T2 spectrum for the initial water-saturated cores and for the water saturated cores after CO2 flooding and cleaning. |
| In the text | |
|
Fig. 10 Comparison of T2 spectrum for the initial oil-saturated cores and for the oil saturated cores after CO2 flooding and cleaning. |
| In the text | |