Figure 7
Download original image
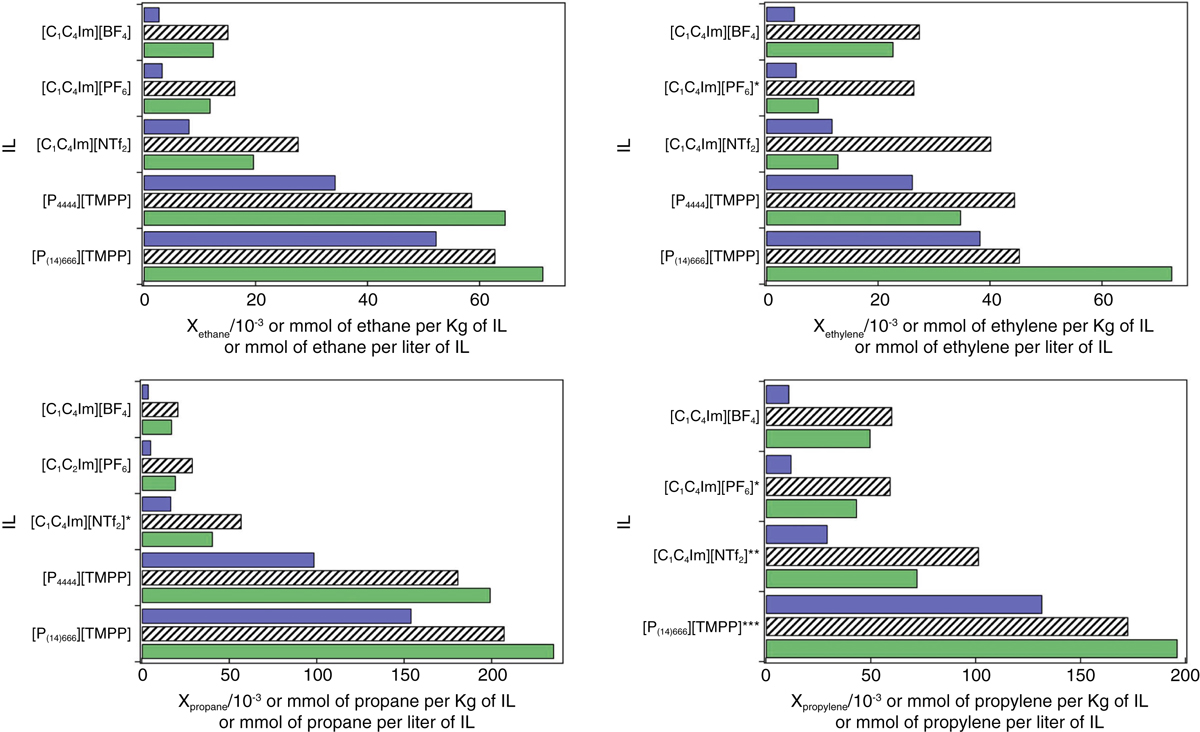
Upper plots: mole fraction (×103, blue bars), quantity of gas per mass of solvent (×104, patterned bars) or per volume of solvent (green bars) of ethane (on the left) and ethylene (on the right) for different ionic liquids. Lower plots: mole fraction (×103, blue bars), quantity of gas per mass of solvent (×104, patterned bars) or per volume of solvent (green bars) of propane (on the left) and propylene (on the right) for different ionic liquids. All the values refer to 1 bar partial pressure of gas and 313 K (* values at 320 K).