Figure 6
Download original image
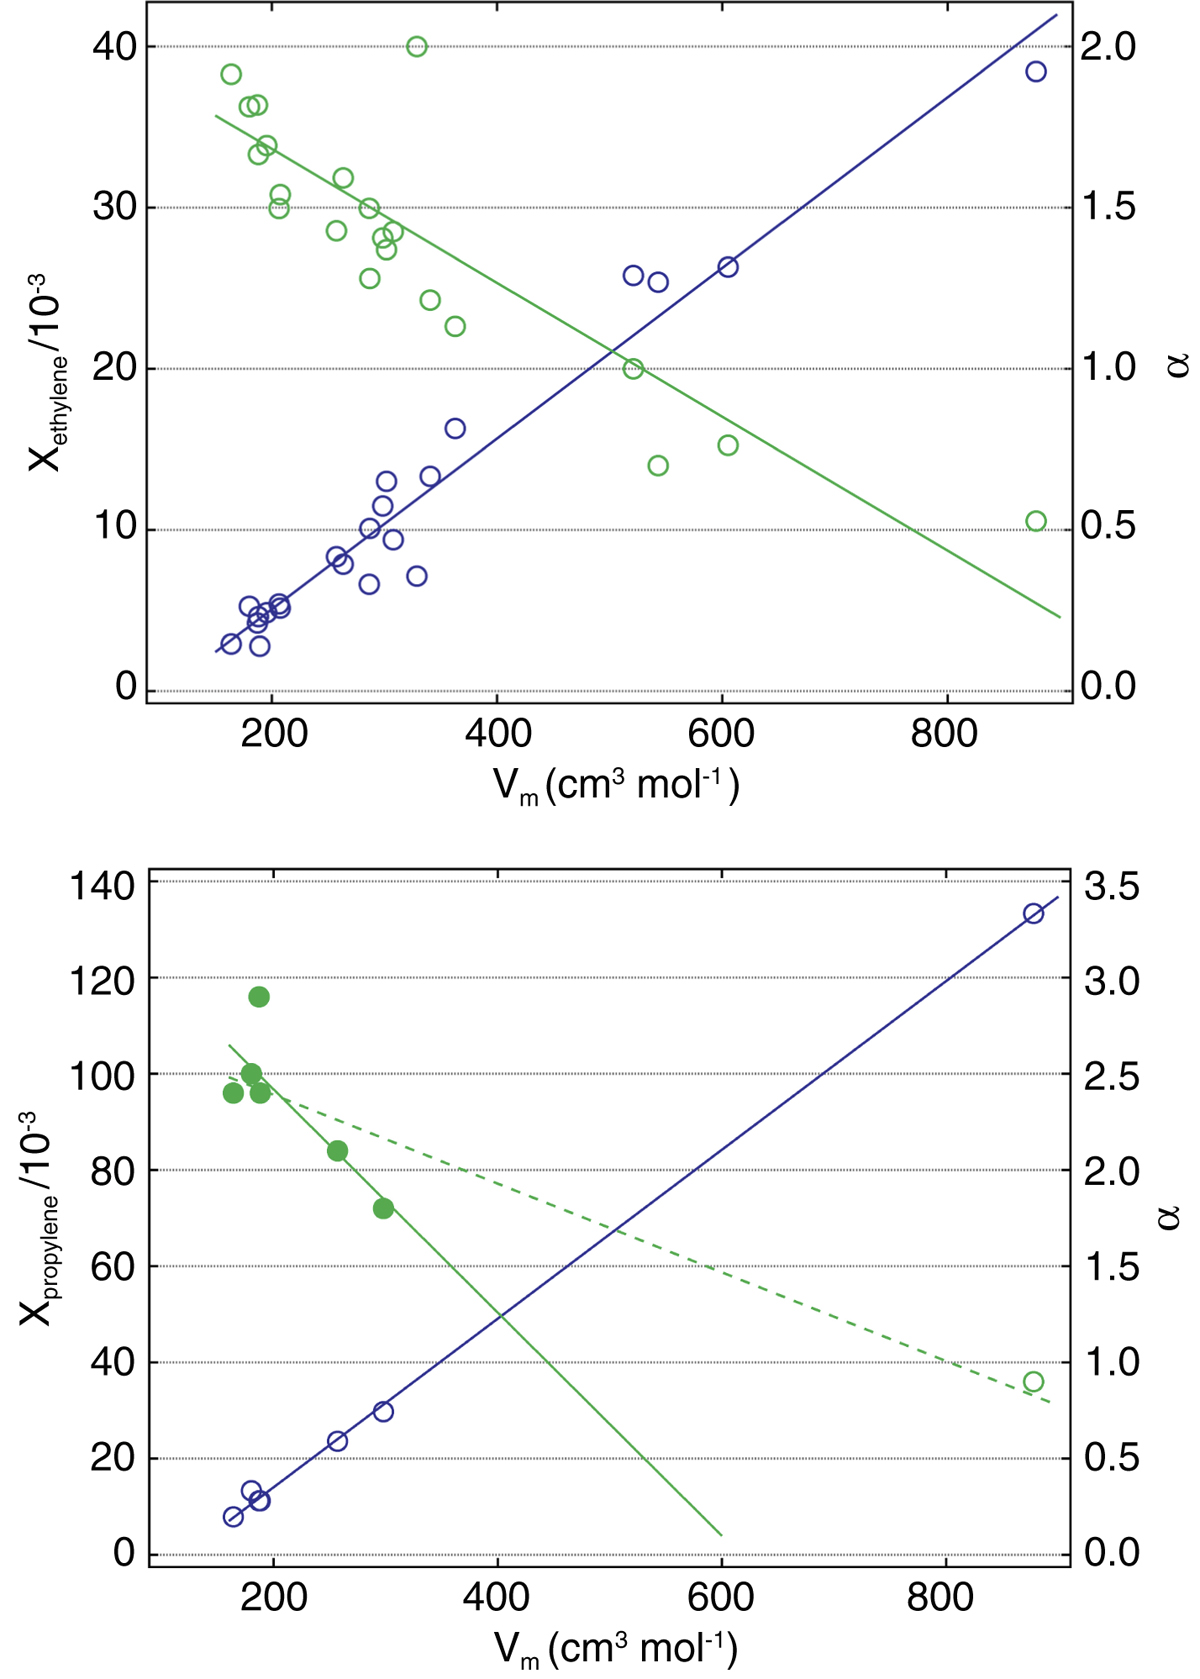
Upper plot: mole fraction absorption capacity for ethylene (x ethylene) in blue and ionic liquid ideal separation selectivity for ethane/ethylene (α) in green versus the molar volume (Vm), in cm3.mol−1, of the ionic liquids. Lower plot: mole fraction absorption capacity for propylene (xpropylene) in light green and ionic liquid’s ideal separation selectivity for propane/propylene (α) in blue versus the molar volume (Vm), in cm3.mol−1, of the ionic liquids. The lines represent the simple linear regression of the data. In the lower plot, the full green line corresponds to the full circles and the dotted line includes also the open circle.