Fig. 6
Download original image
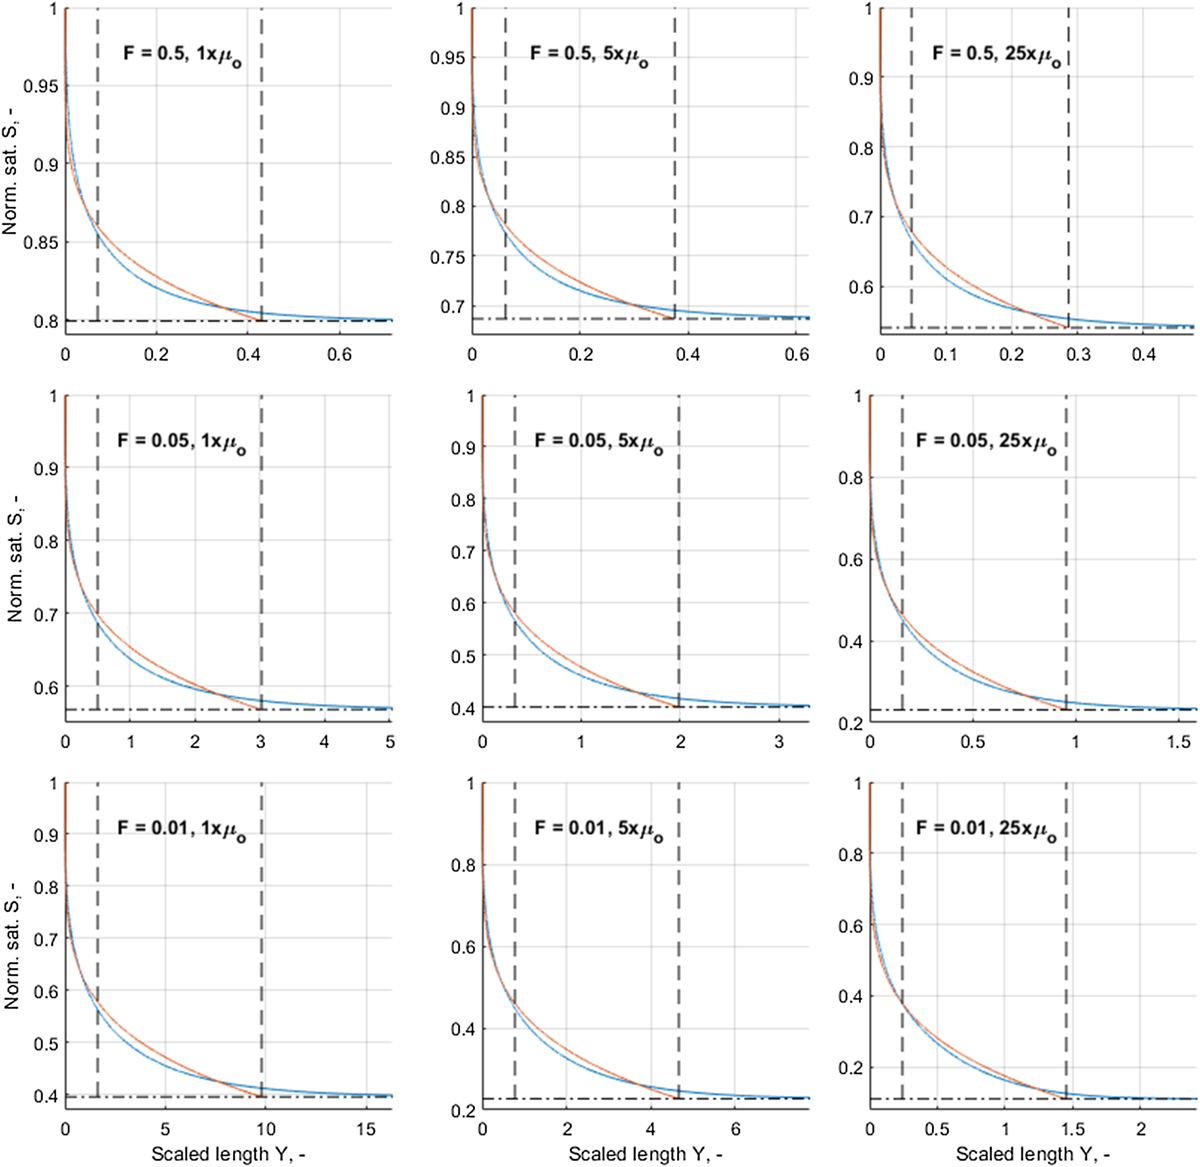
Normalized saturation profiles from the analytical solution (in blue) for different injected flow fractions and oil viscosities and their corresponding approximated saturation profiles assuming polynomial shape for n = 5. The profiles are plotted against Y over the range 0 to 10Yav where Yav and Ycee = (n + 1)Yav are marked with dashed vertical lines left and right, respectively.