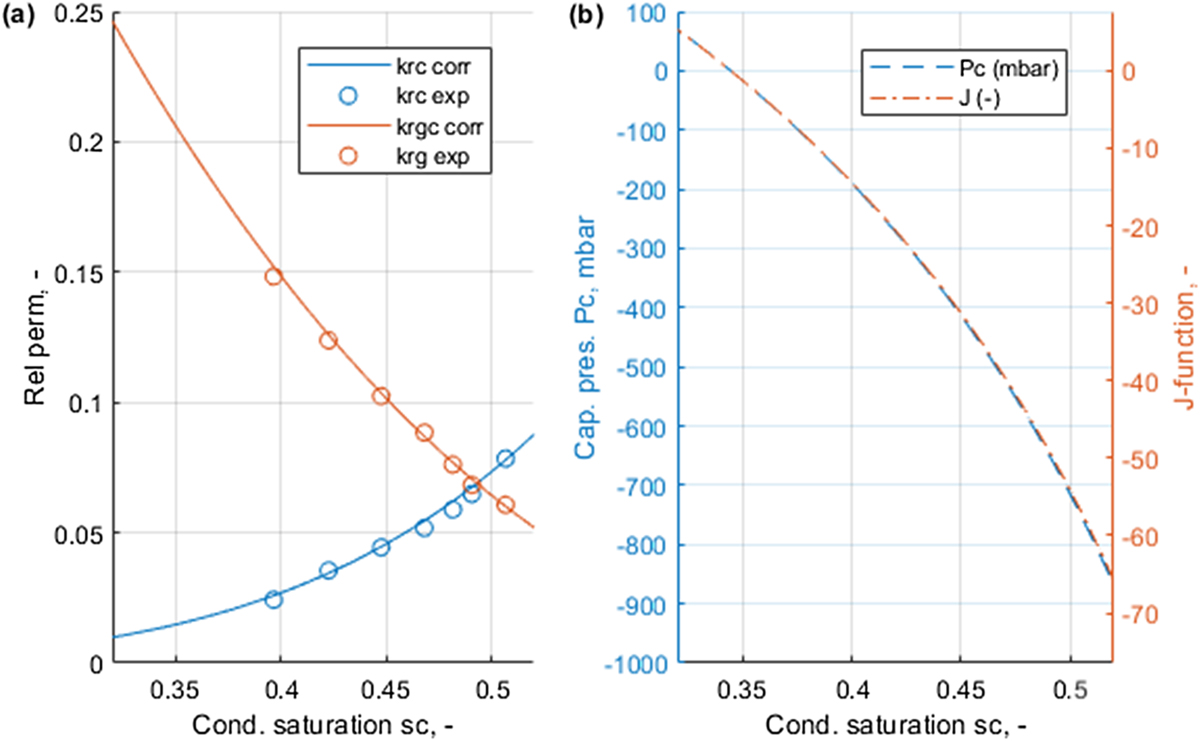
Fig. 18
Download original image
Relative permeabilities in (a) with points based on intercepts from the steady state measurements from Henderson et al. (1998) and the correlations (full lines) using (85) and (86) that best fit the points. The best fitting capillary pressure correlation is shown in (b) as scaled J-function and in mbar based on matching the slope parameters from the steady state measurements.