Fig. 16
Download original image
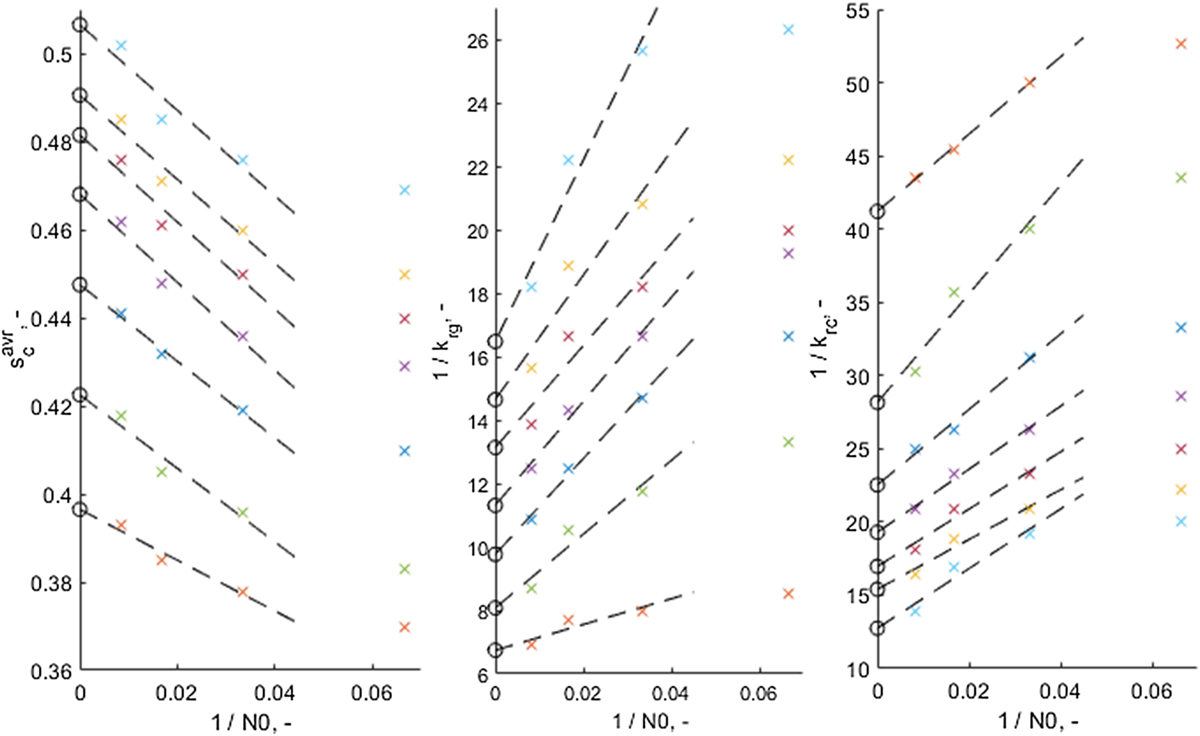
Interpretation of experimental data (crosses) from Henderson et al. (1998) where average condensate saturation (a) and inverse effective relative permeabilities ![]() in (b) and
in (b) and ![]() in (c) are plotted against
in (c) are plotted against ![]() . Straight lines are drawn through the high rate data for each flow fraction F to find the intercept (marked with circle points) corresponding to saturations and relative permeability points corrected for end effects. The slopes of the lines provide values of Cs·Co, Cw at each fraction.
. Straight lines are drawn through the high rate data for each flow fraction F to find the intercept (marked with circle points) corresponding to saturations and relative permeability points corrected for end effects. The slopes of the lines provide values of Cs·Co, Cw at each fraction.