Fig. 14
Download original image
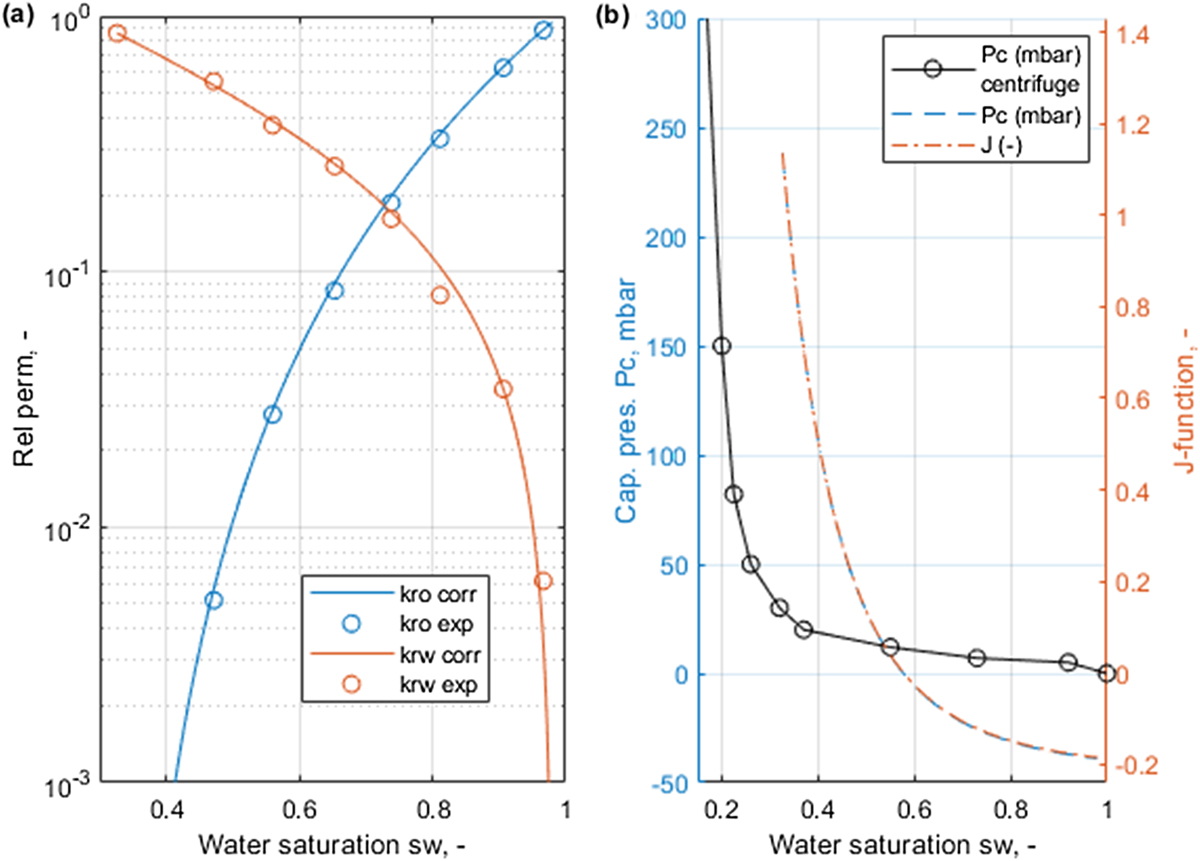
Relative permeabilities in (a) with points based on intercepts from the steady state measurements from Virnovsky et al. (1998) and the correlations (full lines) using (85) and (86) that best fit the points. The best fitting capillary pressure correlation is shown in (b) as scaled J-function and in mbar based on matching the slope parameters from the steady state measurements. The curve is compared to a primary drainage curve measured with centrifuge on the core used in Virnovsky et al. (1998). Our derived J-function is more consistent with the experimental data as reflected in a higher residual water saturation and the presence of negative capillary pressures.