Figure 7
Download original image
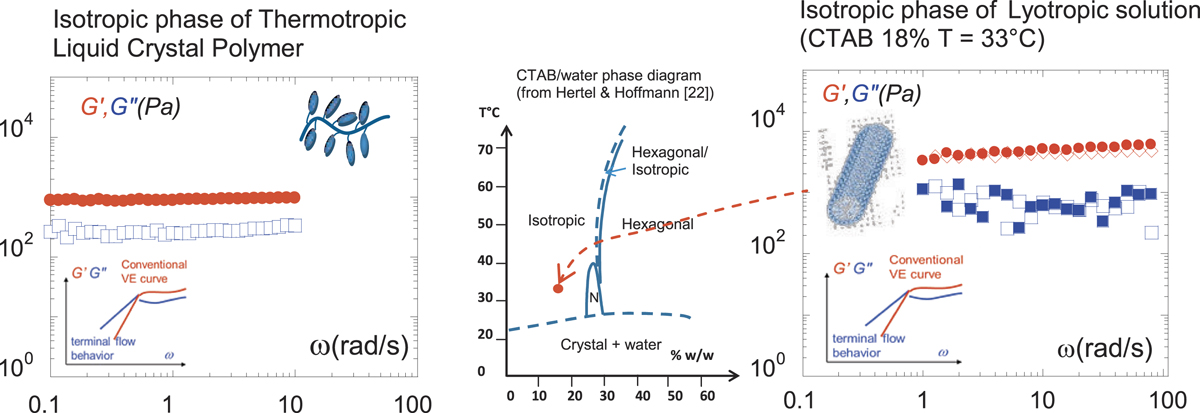
By improving the interactions to the surface, the dynamic measurement reveals a solid-like response (G′ (red ♦) > G″ (◊)) in: a) thermotropic liquid crystal: the liquid phase (here at 14 °C above the isotropic-nematic transition and at 0.150 mm thickness) of a liquid-crystal polymer. The inset displays for comparison the conventional flow behavior [as predicted for uncross-linked polymers (Maxwell model)] [21, 25]. Thermotropic liquid crystal I(isotropic) – 119 °C – N(nematic) – 30 °C – Glassy state. b) CTAB: Phase diagram from reference [22]. Lyotropic liquid crystal: the liquid phase of salt-free CTAB-water (dilution 18%) measured at 33 °C at 0.2% strain amplitude, 0.3 mm gap thickness. The shear modulus and the viscous modulus are independent of the frequency with G′ > G″ indicating a solid-like behavior. Similar responses are obtained by scanning from low to high G′(Pa): red ●, G″(Pa): blue ■ and from high to low frequency G′(Pa): red ◊, G″(Pa): blue □.