Fig. 8
Download original image
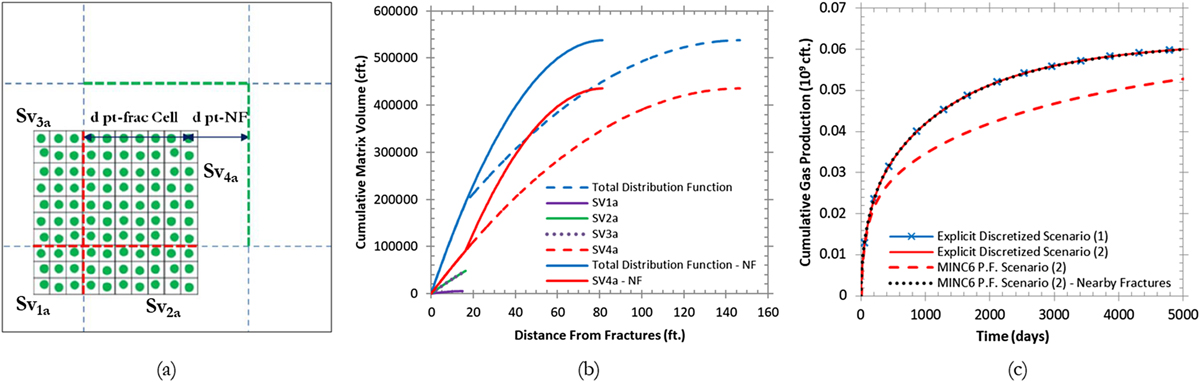
Illustration of (a) the MINC proximity function computed into the studied grid cell and (b) the cumulative matrix volume per sub-volume for model (2) and (2)–NF and (c) comparison of the cumulative gas production for case (1), (2) and (2)–NF.