Fig. 6
Download original image
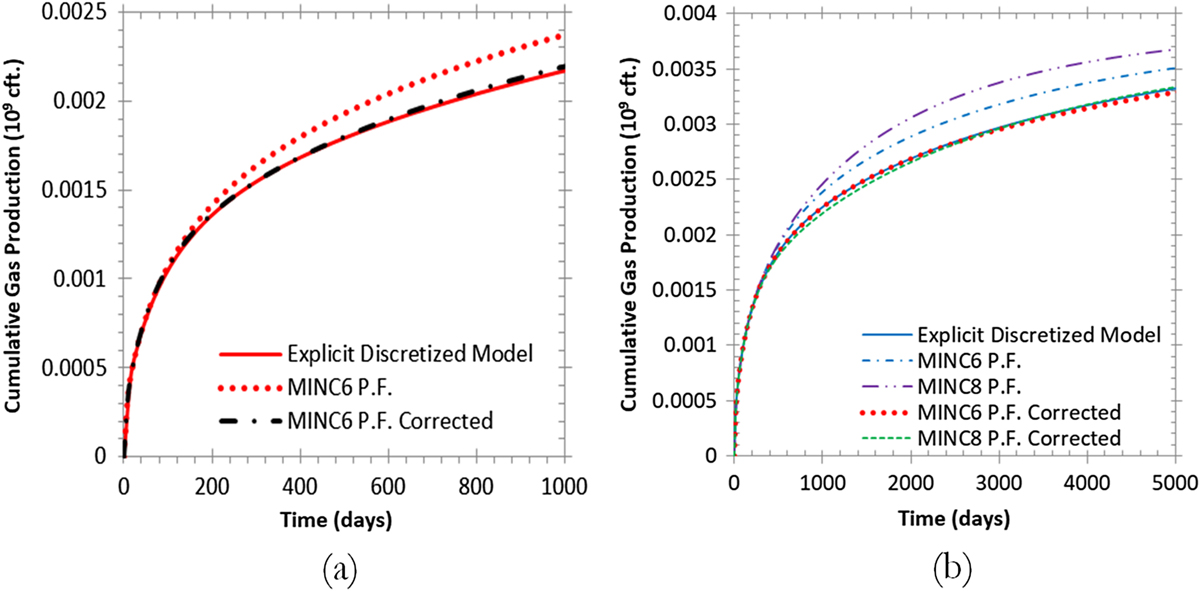
Illustration of the comparison of the cumulative gas production for (a) the explicit discretized model, the MINC6 Proximity Function with and without correction for 1000 days of production for the regular fractures distribution presented in Figures 4a and 4b and (b) the comparison of the cumulative gas production before and after the transmissibility correction for the irregular fractures distribution presented in Figure 5a.