Fig. 3
Download original image
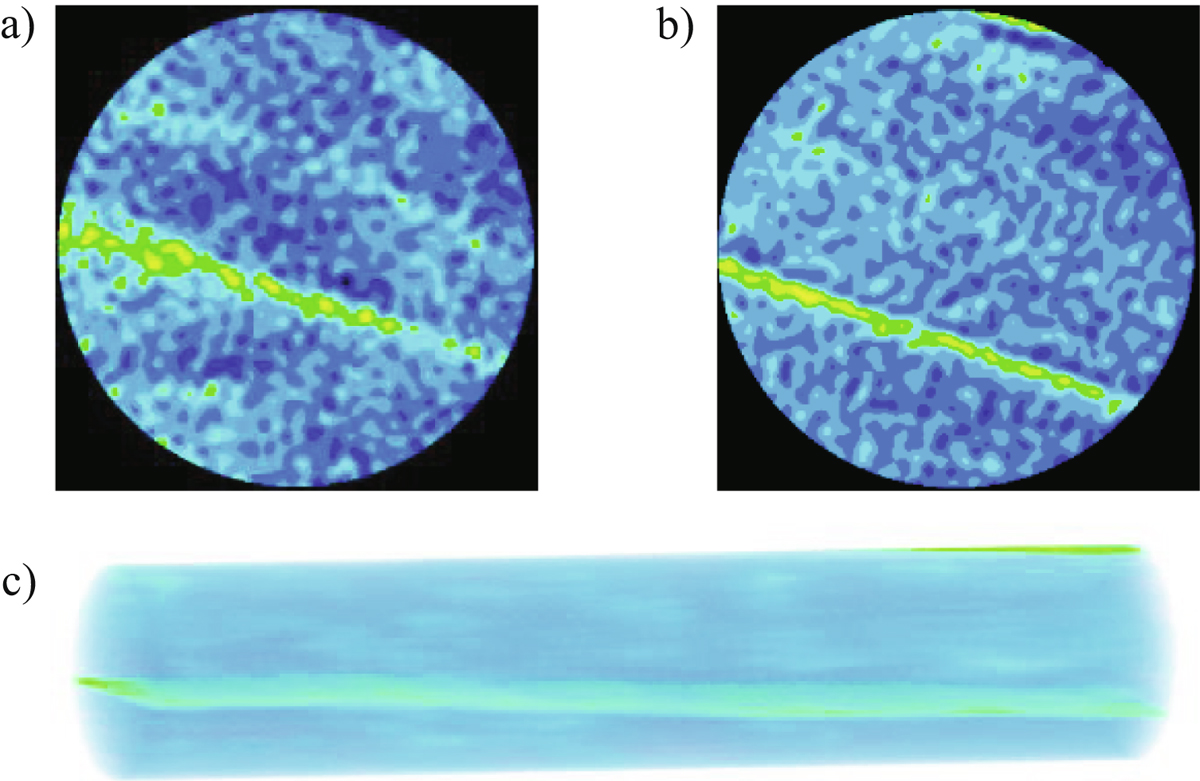
Initial CT analysis of dry rock sample 12A4. Slices 6 and 20 along the rock, respectively (a and b), and 3D reconstruction of the entire rock sample, where the green color represents the laminations and high-density materials (c).