Fig. 1
Download original image
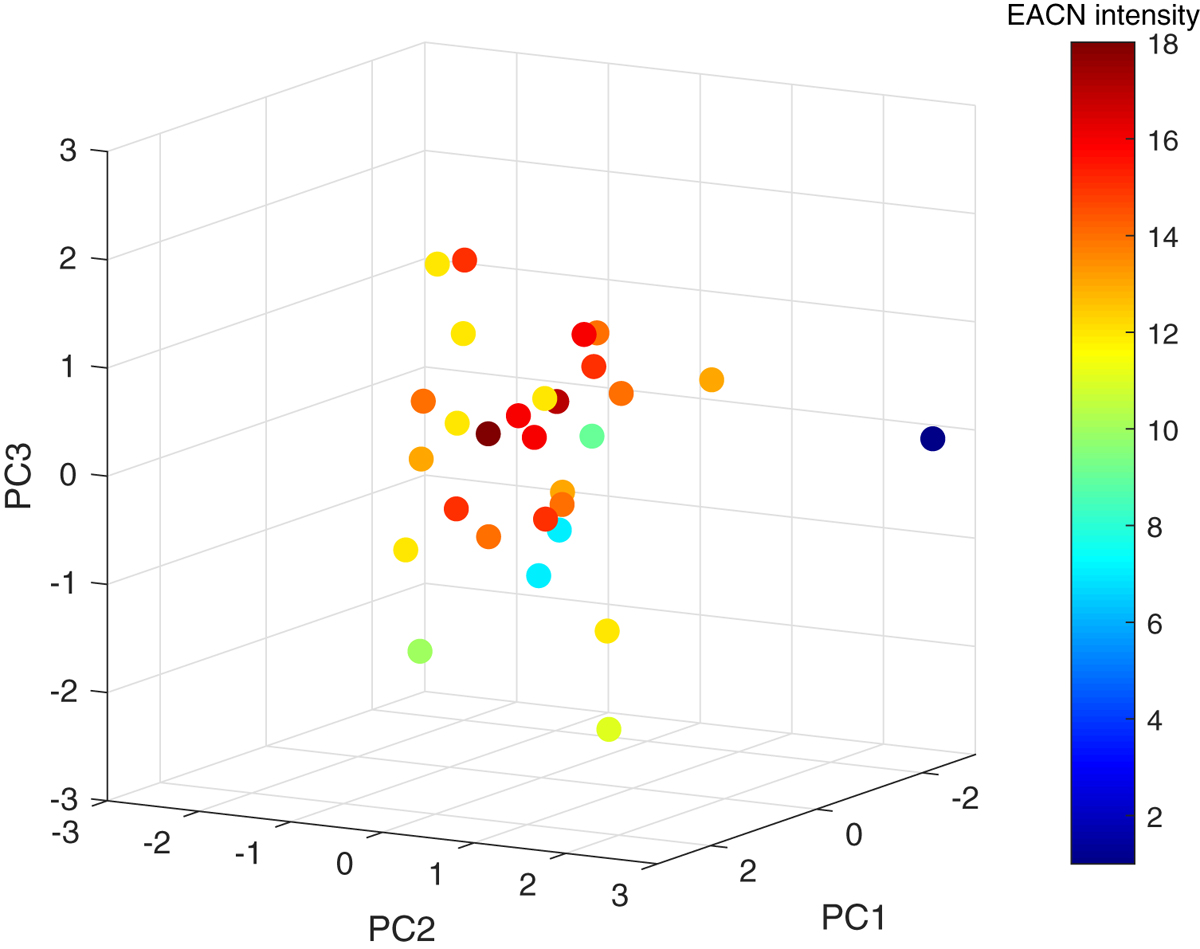
Projections of crude oils on PC1, PC2 and PC3, the three first principal components resulting from the PCA. Symbols are filled using a colorbar and intensities are as follows: low and high EACNdo values are indicated in blue and red, respectively.