Fig. 12

Download original image
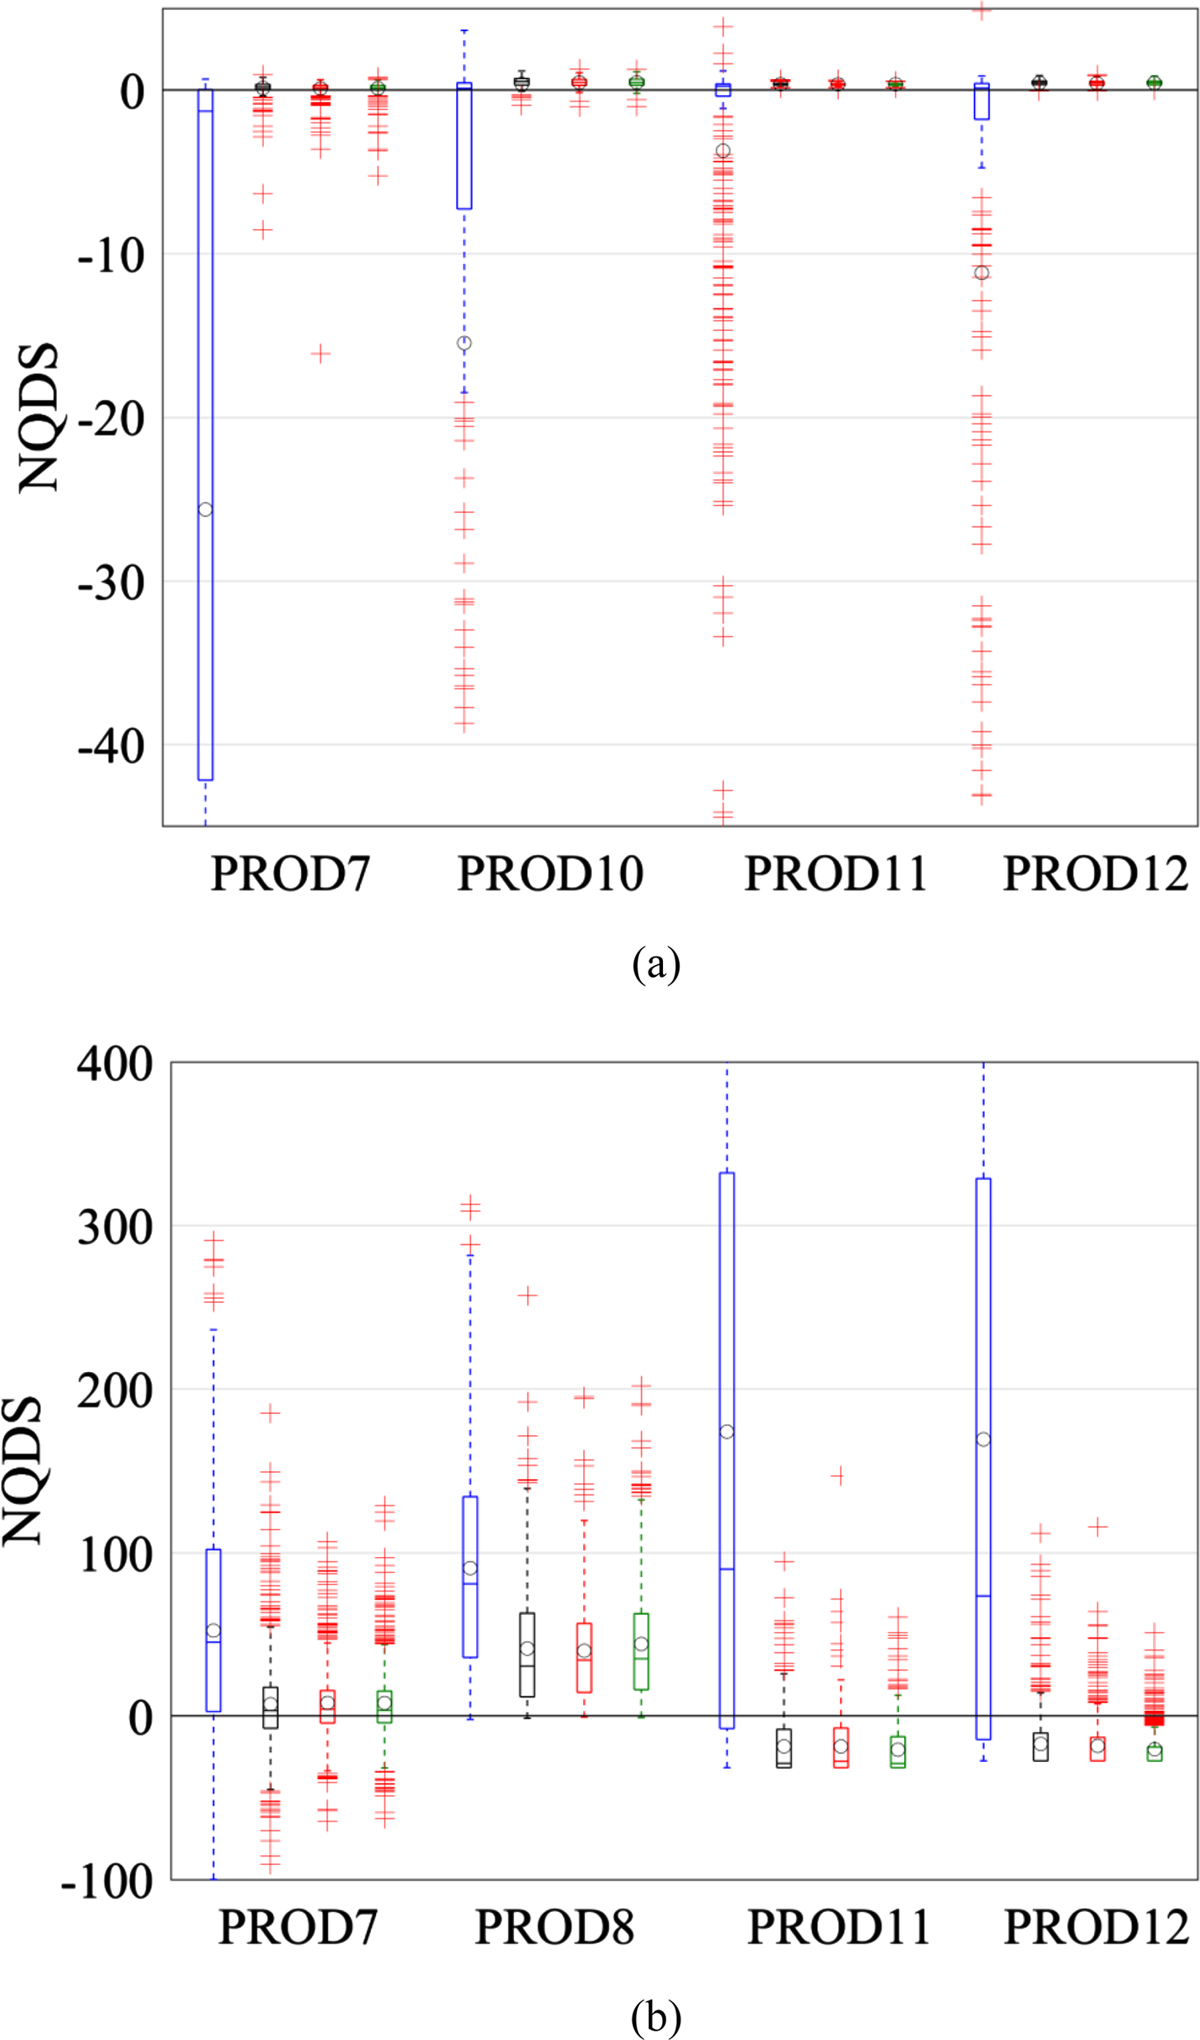
Boxplot of NQDS for (a) bottom-hole pressure of producers 7, 10, 11, and 12 and (b) for water rate of wells 7, 8, 11, and 12 for the initial run (first), Method 1 (second), Method 2 (third), and Method 3 (fourth).
Current usage metrics show cumulative count of Article Views (full-text article views including HTML views, PDF and ePub downloads, according to the available data) and Abstracts Views on Vision4Press platform.
Data correspond to usage on the plateform after 2015. The current usage metrics is available 48-96 hours after online publication and is updated daily on week days.
Initial download of the metrics may take a while.