Fig. 18.
Download original image
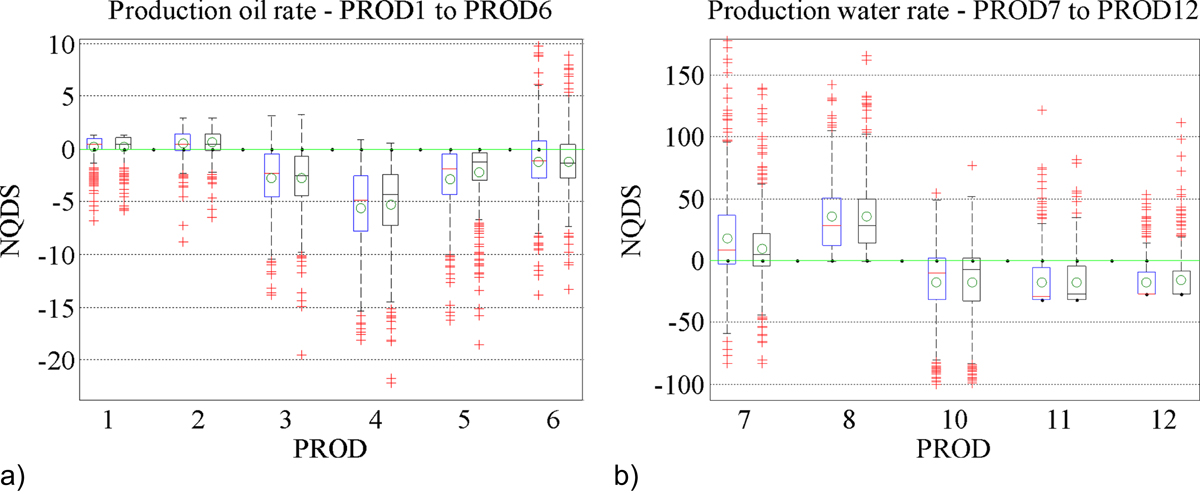
Boxplot of NQDS of production rates after three iterations. Graphics show the last two iterations for each well in pairs; G2It2 to the left and G2It3 to the right. Figure (a) shows wells 1–6 for oil rate and Figure (b) shows wells 7–12 for water rate.