Fig. 3.
Download original image
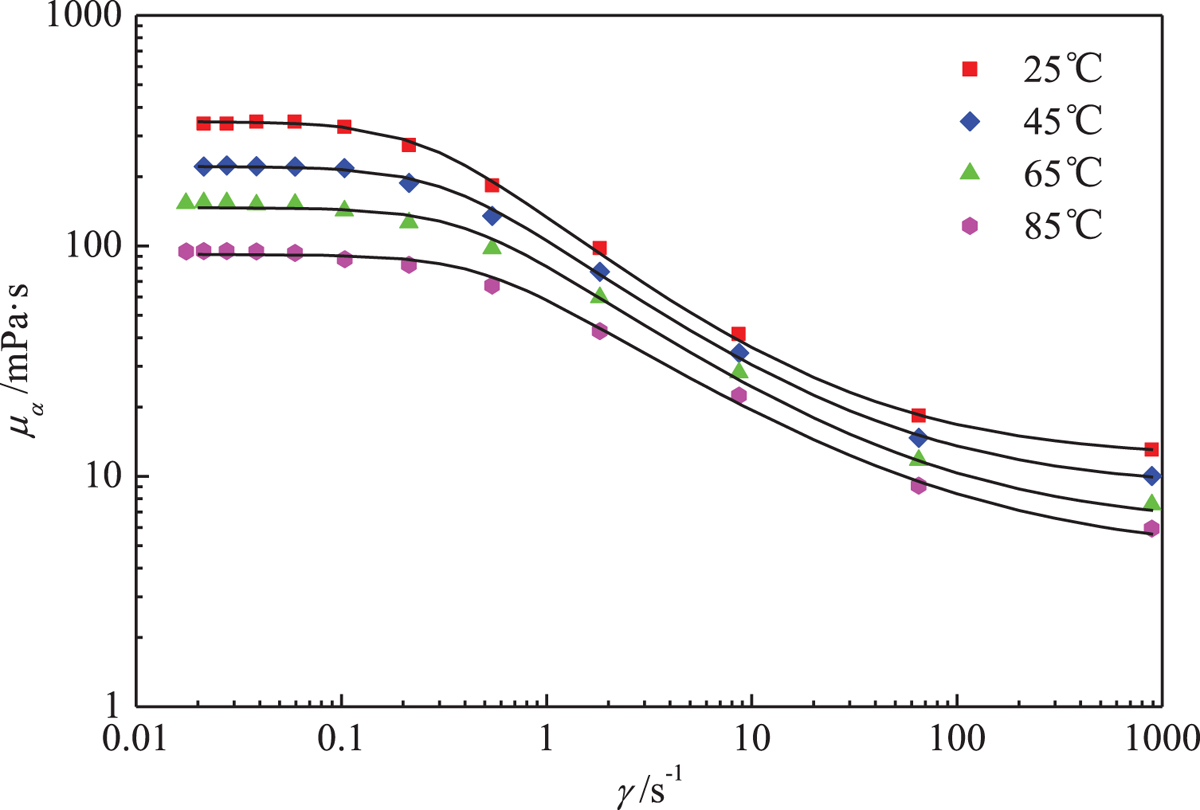
Variation of slick-water viscosity against shear rate under different temperatures; symbols refer to measured data, while lines represent fitted results by Chang–Darby rheological model.
Variation of slick-water viscosity against shear rate under different temperatures; symbols refer to measured data, while lines represent fitted results by Chang–Darby rheological model.
Current usage metrics show cumulative count of Article Views (full-text article views including HTML views, PDF and ePub downloads, according to the available data) and Abstracts Views on Vision4Press platform.
Data correspond to usage on the plateform after 2015. The current usage metrics is available 48-96 hours after online publication and is updated daily on week days.
Initial download of the metrics may take a while.