Figure 7
Download original image
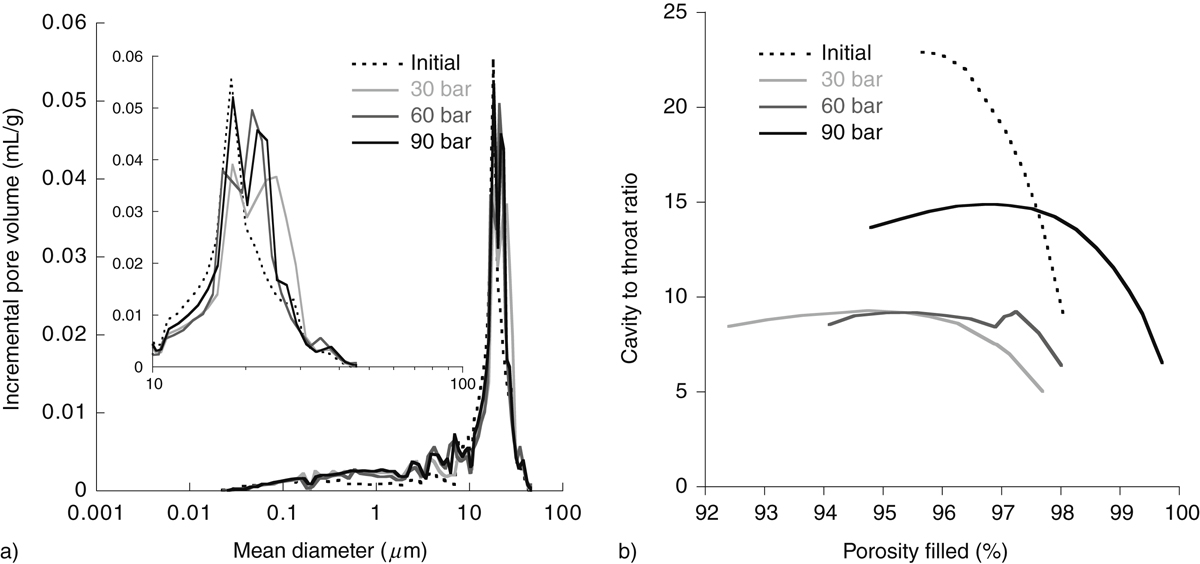
St-Emilion carbonate mercury injection data comparison for initial carbonate, and reacted powder at 30, 60, and 90 bar of CO2. a) Incremental pore volume as a function of the mean pore diameter. A zoom of the 10-100 μm range is added on this figure. b) Cavity to throat ratio evolution with respect to porosity filling.