Fig. 15
Download original image
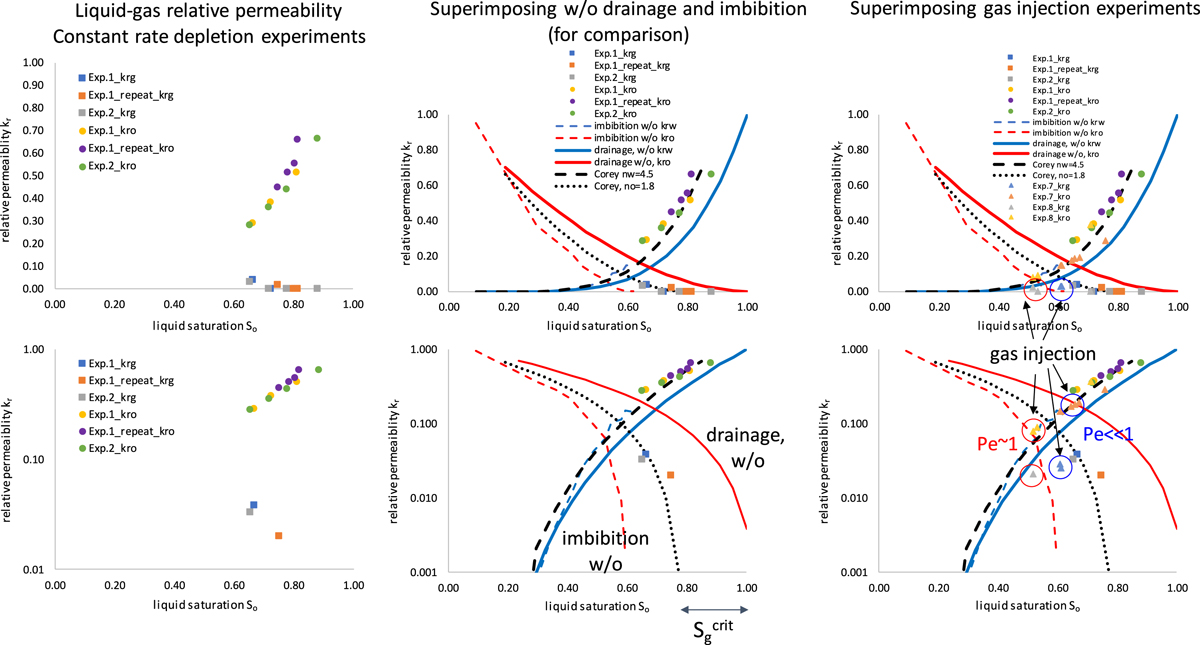
Relative permeability for liquid and gas (left column) computed by single-phase flow simulations (LBM method) on the fluid distribution obtained from micro-CT. The gas relative permeability follows a drainage relative permeability curve when re-scaling the saturation endpoint to the critical gas saturation (middle column). The liquid relative permeability follows more wetting-phase imbibition curve but is overall also compatible with a drainage curve. The relative permeability for gas injection (left column) clearly deviates from the pressure depletion curves, indicating that gas injection follows a different transport mechanism.