Fig. 10
Download original image
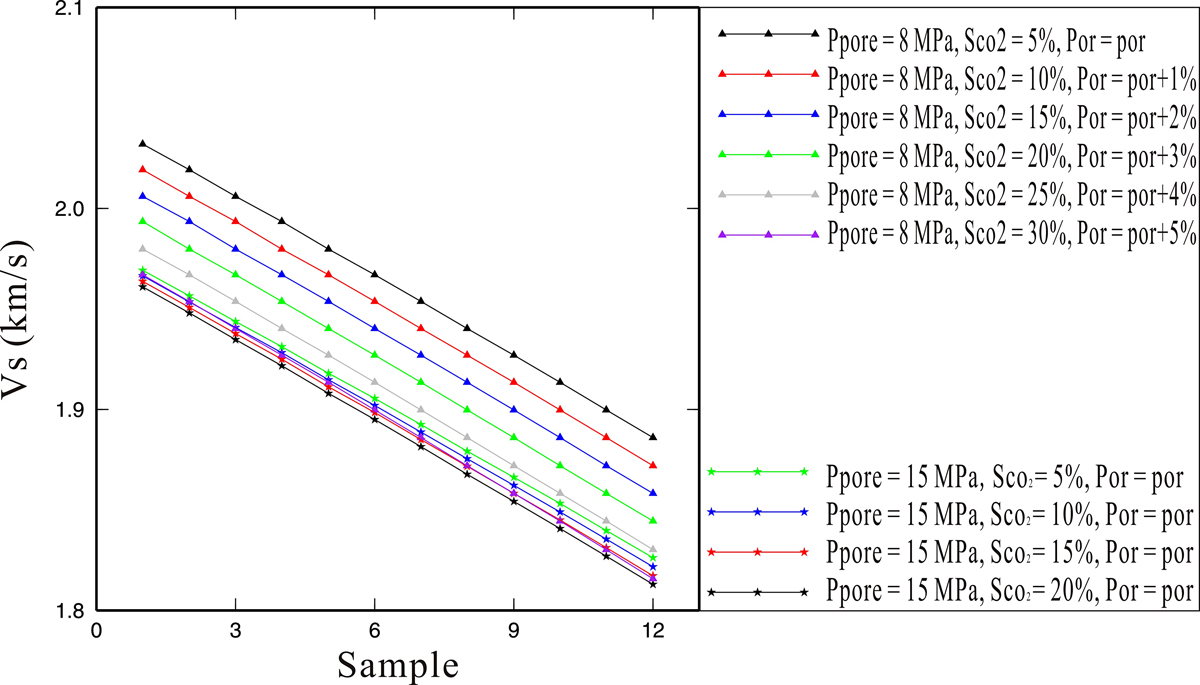
Variations in the S-wave velocity with the porosity. The x-axis is the sample number, and the y-axis is the S-wave velocity. The triangle symbols represent the S-wave velocity at a pore pressure of 8 MPa and the original porosity (0.18–0.29). The black colour indicates a CO2 saturation of 5%, while the red, blue, green, grey, and purple colours represent CO2 saturations of 10%, 15%, 20%, 25%, and 30% and porosities that are 1–5%, respectively, higher than the original value. The star symbols represent a pore pressure of 15 MPa. The green, blue, red and black colours represent S-wave velocities with CO2 saturations of 5%, 10%, 15%, and 20%, respectively, for similar porosities.