Regular Article
The relationship between stress of plate-fin structures and emergency stop operation process in LNG heat exchanger
1
School of Civil Engineering and Architecture, East China Jiaotong University, Nanchang 330013, PR China
2
School of Civil Engineering, Lanzhou University of Technology, Lanzhou 730050, PR China
* Corresponding author: mhq2014@sina.com
Received:
30
September
2021
Accepted:
10
November
2021
For insuring the safe operation of LNG heat exchanger in the Emergency Stop Operation Process (ESOP), a numerical method is proposed to investigate the stress of Plate-Fin Structures (PFS) in that. The relationship between stress of PFS and ESOP is analyzed in LNG heat exchanger. The results will be obtained that the maximum equivalent stress of PFS is greater at the initial stage of ESOP than that at the last stage when the HMR pressure is more than 5 MPa. The maximum equivalent stress increases with the equilibrium temperature when is greater than 180 K and reaches peak value at the last stage of ESOP. The maximum equivalent stress is larger at the last stage of ESOP than the other stage and increases with the equilibrium pressure. When the temperature difference is more than 5 K in the ESOP, the influence of that is obvious for the stress of PFS. In the ESOP, the equilibrium temperature and temperature difference should be controlled within 240 K and 5 K, respectively.
© H. Ma et al., published by IFP Energies nouvelles, 2021
 This is an Open Access article distributed under the terms of the Creative Commons Attribution License (https://creativecommons.org/licenses/by/4.0), which permits unrestricted use, distribution, and reproduction in any medium, provided the original work is properly cited.
1 Introduction
The Plate-Fin Structures (PFS) are a key component of heat exchanger in the Liquid Natural Gas (LNG) plants [1, 2]. It consists of the corrugated fins and plates [3–5]. The stress concentration and structural failure of PFS may be induced in the ESOP. This will impact the structure safety of PFS if the ESOP is unreasonable for the LNG heat exchanger. Therefore, the investigation on the relationship between stress of PFS and ESOP will have importantly significance to guide the ESOP of LNG heat exchanger.
Many works have been done on the stress of PFS which is used to manufacture the heat exchanger. However, these works are mainly focused on the residual stress of PFS [6–8]. For example, in Chen’s study [9], a two-dimensional model is established to analyze the residual stress of PFS in the brazing process. It is obtained that the residual stress have obviously influence for structural failure of PFS. In Refs. [10], a similar model is also established to investigate the residual stress of PFS. Jiang et al. [4, 11, 12] analyzed the influence of geometric structure for the residual stress of PFS which is made of 304 stainless steel. It was found that the residual stress of PFS is mainly influenced by the filler metal thickness. In our previous work, the influence of the heat-up or cool-down process was also analyzed for the stress of PFS. A method was proposed to control the operation parameters in the heat-up or cool-down process [13]. Meanwhile, stress characteristics of PFS are also investigated under the different structural and operational parameters [14]. According to the above analysis, there are some investigations about the stress characteristics of PFS in LNG heat exchanger. However, it is still lack for the relationship between stress of PFS and ESOP.
In this paper, a model is established to investigate the stress of PFS in the ESOP. The relationship between stress of PFS and ESOP in LNG heat exchanger was analyzed by the finite element method. A method was proposed to control the ESOP of LNG heat exchanger.
2 Analysis of ESOP
In order to relieve the stress concentration and structural failure of PFS, the ESOP must be performed for heat exchanger in large LNG plant. The structural failure of PFS may be occurred if the ESOP is unreasonable. Thus, it is essential to investigate the relationship between stress of PFS and ESOP.
Figure 1 is the NG liquefaction process in heat exchanger. The MR consists of two parts in the liquefied heat exchanger: The HMR (Mixture Refrigerant at the Highly pressure condition) is cooled from 210 K to 150 K. The HMR becomes the liquid phase. The LMR (Mixture Refrigerant at the Low pressure condition) is heated and vaporized by the heat flux which comes from the HMR. The temperature of that will increase from 155 K to 215 K. The flows of HMR and LMR are counterflow in that. At the same time, the HMR is cooled by the LMR and changed into LMR by the throttle value. In this paper, the influences of LMR and HMR operation parameters for stress characteristics of PFS are analyzed in the ESOP of LNG heat exchanger.
 |
Fig. 1 The NG liquefaction process in liquefied heat exchanger. |
For HMR and LMR in LNG heat exchanger, the pressure of HMR decreases and that of LMR increases with the operation time if the throttle value is not shut in the ESOP. The pressure of HMR is finally balanced with that of LMR. By the heat transfer in crosswise direction of LNG heat exchanger, the temperature of HMR and LMR increases as the operation time increases in the ESOP. And the temperature finally reaches the equilibrium state between LMR and HMR. In practical engineering, the temperature or pressure of MR is intricately changed with the operation time in ESOP. In order to conveniently analyze the relationship between stress of PFS and ESOP, the follow simplification should be needed: (1) The temperature difference is assumed to be constant between HMR and LMR in the ESOP because that the influence of temperature change rate of LMR is not obvious for the stress of PFS [15]. In other word, the temperature change rate of LMR remains constant in the ESOP and is the same as that of HMR. Finally, the temperature of LMR reaches the balance temperature (Tb). (2) The HMR pressure is assumed to linearly decrease with the operation time in the ESOP. The LMR pressure linearly increases with the operation time of that. And the pressure of HMR and LMR finally reaches the balance pressure (Pb). Figure 2 is the diagram of relationship between the pressure and temperature of MR (LMR and HMR) and the operation time in the ESOP which the operational parameters in the normal operation are the HMR pressure PHMR = 4.1 MPa, LMR pressure PLMR = 0.4 MPa, HMR temperature THMR = 160 K and LMR temperature TLMR = 150 K. The relationship between stress of PFS and ESOP is analyzed in the ESOP based on the above assumptions.
 |
Fig. 2 The diagram of relationship between the pressure and temperature of MR (LMR and HMR) and the operation time in the ESOP. |
3 Finite element analysis method
3.1 Analysis model
The PFS are a key component of heat exchanger which is used in LNG plant. It mainly consists of fins and plates [16, 17]. Figure 3 is the diagram of PFS. Table 1 is the detailed structural parameters of that. According to Figure 1, the structures are cyclic repeatability and complexity for PFS in LNG plate-fin heat exchanger. Some problems should be assumed for simplifying the analysis model in order to conveniently analysis. In this paper, the relationship between stress of PFS and ESOP is assumed to be no impacted by the layers number. The flow of HMR alternates with that of LMR and counter-flows, as shown in Figure 3. The fluid temperature variations along the length direction of PFS are neglected in a very short length (L). Thus, only one unit of PFS was analyzed which makes up of four layers plate and fin. And the length (L) of that is in a very short, as shown by dotted lines in Figure 3. The simplified model on PFS is showed in Figure 4a. Figure 4b is the local structure of region 2 in Figure 4a. In this analysis model, the interface between plate and brazing material and between brazing material and fin is defined as Path 1 and Path 2, respectively. The regions 1 and 2 are the brazed joint of PFS which is the small transitional arc on the two terminals of the brazing seam. Path 3 is located at the position that is along the brazed joint (region 2 in Fig. 4) and rectangular region (region 3 in Fig. 4).
 |
Fig. 3 The diagram of PFS. d is Plate thickness; h, Fin height; L, Effective length; f, Fin thickness; and g, Fin width |
 |
Fig. 4 The model of PFS and local structures. (a) The model of brazed structure. (b) The local structure in brazed joint (region 2). |
Geometric structure parameters (from No. 1 to No. 5 are defined from the bottom plate to tops).
Meanwhile, according to the literature [13], the materials of fin or plate and brazing material are assumed to be AL3003 and AL4004, respectively. For obtaining precise results, it is assumed that the coefficient of expansion and elasticity modulus is associated with the temperature of AL3003 and AL4004. Table 2 is the property parameters of AL3003 and AL4004.
The property parameters of AL3003 and AL4004 used in this model.
3.2 Analysis strategy
In this paper, the finite element method on directly coupling coupled solution is adopted to analyze the relationship between stress of PFS and ESOP. The array parameter is applied to define the boundary conditions on the ESOP.
The heat transfer process between L/HMR and the PFS is simulated by the convective heat transfer boundary. Due to the periodicity and symmetry of PFS, cyclical symmetry boundaries are considered on the surfaces in x = 0 m and 2 mm. The bottom surface in this model is restrained in y direction. The interaction between HMR or LMR and the wall of PFS is simulated by the operational pressures of LMR (or HMR). The simulation process is programmed with ANSYS Parametric Design Language. According to the Von Mises yield criterion, the plastic yield failure may occur in the position of PFS which the equivalent stress is greater than the allowable stress. The position of structural failure corresponds to that of the maximum equivalent stress in the ESOP. That is, the maximum equivalent stress is concerned in follow investigation.
4 Results and discussion
According to the Section 2, the LMR temperature and pressure finally reach the LMR balance temperature (Tb) and balance pressure (Pb) in the ESOP, respectively. The Tb and Pb are mainly impacted by the HMR and LMR content in LNG heat exchanger and the operation. It is distinct in the different design conditions or the ESOP. At the different design conditions, it is also distinct for the HMR pressure, heat exchange performance of heat exchanger and temperature difference (between HMR and LMR). In order to obtain the universality results, the relationship between stress of PFS and ESOP is analyzed at different operation time at the above different parameters set.
4.1 Influence of heat transfer performance for stress
In the LNG heat exchanger, the LMR will be heated by the heat flux which comes from the NG or HMR and becomes from liquid phase to vapor phase. The HMR will be cooled from 210 K to 150 K by the heat transfer. The LMR or HMR heat transfer coefficient is distinct in the heat transfer process of different ESOP. Therefore, the relationship between stress of PFS and ESOP is analyzed at the different LMR or HMR heat transfer coefficient for the MR temperature TLMR = 150 K and fluid pressure PHMR = 4.1 MPa, PLMR = 0.4 MPa.
Figures 5 and 6 are the datum on the relationship between the maximum equivalent stress of PFS and operation time at different heat transfer coefficient for temperature difference ΔT = 10 K, the operation time τ = 120 min, equilibrium pressure Pb = 1.0 MPa and equilibrium temperature Tb = 180 K. The results show that the influence of heat transfer performance is small for the structural failure of PFS in whole ESOP. Meanwhile, the maximum equivalent stress of that decreases with the operation time when that is less than 50 min. Otherwise, the maximum equivalent stress of PFS increases with the operation time in the ESOP.
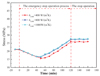 |
Fig. 5 The relationship between the maximum equivalent stress and operation time at different hLMR. |
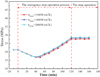 |
Fig. 6 The relationship between the maximum equivalent stress and operation time at different hHMR. |
4.2 Influence of equilibrium temperature for stress
In this section, the influence of equilibrium temperature on the stress characteristics of PFS in the ESOP is analyzed at the MR temperature TLMR = 150 K and fluid pressure PHMR = 4.1 MPa, PLMR = 0.4 MPa. Figure 7 is the relationship between the maximum equivalent stress and the operation time at different equilibrium temperature for temperature difference ΔT = 10 K, the operation time τ = 120 min, equilibrium pressure Pb = 1.0 MPa and heat transfer coefficient hHMR = 1500 W/(m2 K), hLMR = 1000 W/(m2 K). It can be obtained that the maximum equivalent stress increases as the operation time increases. The higher equilibrium temperature is, the faster maximum equivalent stress increases. The structural failure of PFS may be occurred when the equilibrium temperature is more than 240 K in the ESOP (The yield strength of PFS is about 142 MPa). The maximum equivalent stress of PFS is higher at the stage of stop operation than that at the ESOP. Therefore, the influence of equilibrium temperature is apparent for the structural failure of PFS. For relieving the stress failure of PFS, the equilibrium temperature should be strictly restricted in the ESOP.
 |
Fig. 7 The relationship between the maximum equivalent stress and operation time at different Tb. |
In order to further investigate the relationship between stress of PFS and ESOP at the different equilibrium temperature, the stress distribution at different equilibrium temperature is also given in region 2. Figures 8 and 9 are the distribution of equivalent stress and stress along different directions in region 2, respectively. It is described at different equilibrium temperature when the operation time is 120 min in the ESOP. The results from Figure 8 show that equivalent stress of PFS is apparently influenced by the equilibrium temperature and will reach the maximum value at the brazing joint near plate. Namely, the structural failure of PFS induced by the equivalent stress may be occurred at the brazing joint near plate. According to Figure 9, the direct stresses along x and z directions at the brazing joint near plate are apparently affected by the equilibrium temperature. At the brazing joint near fin, the direct stress along y direction is also apparently affected by that. Therefore, in the ESOP, the influence of equilibrium temperature for the structural failure of PFS should be induced by the direct stresses along x and z directions.
 |
Fig. 8 The equivalent stress along path 3 in region 2 at different Tb. |
 |
Fig. 9 The stress along path 3 in region 2 at different Tb. (a) The direct stress along x direction. (b) The direct stress along y direction. (c) The direct stress along z direction. (d) The shear stress on x-y plane. |
4.3 Influence of equilibrium pressure for stress
The equilibrium pressure is also a key parameter to influence the structural failure of PFS in the ESOP. Therefore, the influence of equilibrium pressure is also analyzed on the stress characteristics of PFS at the fluid pressure PHMR = 4.1 MPa, PLMR = 0.4 MPa and MR temperature TLMR = 150 K.
Figure 10 is the relationship between the maximum equivalent stress and the operation time at different equilibrium pressure for the operation time τ = 120 min, temperature difference ΔT = 10 K, equilibrium temperature Tb = 180 K and heat transfer coefficient hHMR = 1500 W/(m2 K), hLMR = 1000 W/(m2 K) in the ESOP. It can be obtained that the maximum equivalent stress in PFS increases with the equilibrium pressure in the ESOP. The maximum equivalent stress decreases with the operation time when the operation time is less than 50 min. Otherwise, the maximum equivalent stress increases with the operation time. The maximum equivalent stress is larger at the last stage of ESOP than the other stage.
 |
Fig. 10 The relationship between the maximum equivalent stress and operation time at different Pb. |
Figures 11 and 12 are the distribution of equivalent stress and stress along different directions in region 2 at different equilibrium pressure, respectively. It is plotted at different equilibrium pressure when the operation time is 120 min in the ESOP. The results show that the equivalent stress is greater at the brazing beam than that at the other position when the equilibrium pressure is 1.0 MPa in the ESOP. The increase of equivalent stress is faster with equilibrium pressure at the brazed joint near fin than that at the other position. Therefore, the brazed joint near fin is the main position of structural failure for PFS which may be induced by the equilibrium pressure. The influence of equilibrium pressure is slight for equivalent stress at the brazed joint near plate. Compare with Figure 7, the structural failure position of PFS induced by the equilibrium pressure is different from that induced by the equilibrium temperature. According to Figure 12, the influence of equilibrium pressure is more obvious for the direct stress of PFS along y direction than that along other directions. Meanwhile, the direct stress along y direction also increases with the equilibrium pressure and is greater at the brazed joint near fin than that at the other position. Thus, the direct stress along y direction is the mainly reason to result in the structural failure of PFS.
 |
Fig. 11 The equivalent stress along path 3 in region 2 at different Pb. |
 |
Fig. 12 The stress along path 3 in region 2 at different Pb. (a) The direct stress along x direction. (b) The direct stress along y direction. (c) The direct stress along z direction. (d) The shear stress on x-y plane. |
4.4 Influence of the temperature difference for stress
In the different ESOP, the temperature difference is distinct between HMR and LMR. The stress concentration of PFS may be induced by the temperature difference. Therefore, the stress characteristic of PFS in the different ESOP is analyzed under different temperature difference for the fluid pressure PHMR = 4.1 MPa, PLMR = 0.4 MPa and MR temperature TLMR = 150 K.
Figure 13 is the relationship between the maximum equivalent stress and operation time at different temperature difference for equilibrium pressure Pb = 1.0 MPa, the operation time τ = 120 min, equilibrium temperature Tb = 180 K and heat transfer coefficient hHMR = 1500 W/(m2 K), hLMR = 1000 W/(m2 K) in the ESOP. It can be obtained that the maximum equivalent stress in PFS is larger at the initial and last stage than that in the ESOP when the temperature difference is less than 5 K between HMR and LMR. The maximum equivalent stress of PFS increases with the operation time when the temperature difference is 20 K between HMR and LMR. Meanwhile, the maximum equivalent stress of PFS is apparently impacted by the temperature difference. In other words, when the temperature difference between HMR and LMR is less than 5 K, the structure of PFS is secure in the ESOP.
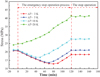 |
Fig. 13 The relationship between the maximum equivalent stress and operation time at different ΔT. |
Figures 14 and 15 are the distribution of equivalent stress and stress along different directions in region 2, respectively. It is plotted at different temperature difference when the operation time is 120 min in the ESOP. The results can be given that the equivalent stress at the brazed joint can be slightly impacted by the temperature difference between HMR and LMR when is less than 5 K in the ESOP. Otherwise, it is apparently impacted by the temperature difference. In order to avoid the structural failure of PFS, the temperature difference should be strictly controlled within 5 K in the ESOP. Meanwhile, the structural failure of PFS induced by the temperature difference may be occurred at the brazing seam according to Figure 14.
 |
Fig. 14 The equivalent stress along path 3 in region 2 at different ΔT. |
 |
Fig. 15 The stress along path 3 in region 2 at different ΔT. (a) The direct stress along x direction. (b) The direct stress along y direction. (c) The direct stress along z direction. (d) The shear stress on x-y plane. |
According to the datum in Figure 15, the direct stress along x direction at the brazed joint near plate is apparently affected by the temperature difference. At the brazed joint near fin, the change of direct stress along z direction is more obvious at the different temperature difference than that at the other position. At the brazing seam, the direct stress along y direction and shear stress on x–y plane is mainly impact by the temperature difference. Therefore, the influence of temperature difference is the interactional results between the direct stress and shear stress for the structural failure of PFS in the ESOP.
4.5 Influence of HMR pressure for stress
For the LNG heat exchanger, the HMR pressure is distinct in the different actual engineering. This may be result in that the stress state is different in the ESOP. Therefore, the influence of HMR pressure is also analyzed on the stress characteristic of PFS at the mixture refrigerant pressure PLMR = 0.4 MPa under the low pressure conditions and MR temperature TLMR = 150 K.
Figure 16 is the relationship between the maximum equivalent stress and operation time under different HMR pressure for equilibrium pressure Pb = 1.0 MPa, equilibrium temperature Tb = 180 K, temperature difference ΔT = 10 K, the ESOP time τ = 120 min and heat transfer coefficient hHMR = 1500 W/(m2 K), hLMR = 1000 W/(m2 K) in the ESOP. It can be obtained that the maximum equivalent stress of PFS is obviously affected by the HMR pressure when the operational time is less than 70 min in the ESOP. Otherwise, the influence of HMR pressure is small for that. When the HMR pressure is more than 5 MPa in design condition, the maximum equivalent stress is smaller at the last stage than that at initial stage in the ESOP.
 |
Fig. 16 The relationship between the maximum equivalent stress and operation time at different HMR pressure. |
At the same time, the stress distributions in region 2 are also analyzed at the initial stage of ESOP. Figures 17 and 18 are the equivalent stress and stress along different directions in region 2 at different HMR pressure, respectively. The results can be obtained that the influence of HMR pressure is obvious for equivalent stress at the brazed joint near fin in the ESOP. Meanwhile, the equivalent stress at the brazed joint near fin is greater than that at the other position. From Figure 18, the direct stress along y direction is obviously impacted by the HMR pressure while the stress along other directions is slightly impacted by that. Meanwhile, the influence of HMR pressure is more apparent for the direct stress along y direction at the brazed joint near fin than that near plate. Therefore, in the ESOP, the structural failure of PFS induced by the HMR pressure should be occurred at the brazed joint near fin and the direct stress along y direction should be mainly impact factor to cause the above results.
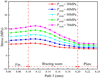 |
Fig. 17 The equivalent stress along path 3 at different PHMR. |
 |
Fig. 18 The stress along path 3 in region 2 at different PHMR. (a) The direct stress along x direction. (b) The direct stress along y direction. (c) The direct stress along z direction. (d) The shear stress on x–y plane. |
5 Conclusion
The relationship between stress of PFS and ESOP is investigated by the finite element method. The some conclusions can be obtained by this study:
In initial stage of ESOP, the maximum equivalent stress of PFS is obviously influenced by the HMR pressure and is larger at the initial stage than that in last stage when the HMR pressure is more than 5 MPa. The structural failure of PFS caused by the HMR pressure should be occurred at the brazed joint near fin and the direct stress along y direction should be main reasons to cause that. In the whole ESOP, the structural failure of PFS is slightly impacted by the heat transfer performance.
For the PFS, the maximum equivalent stress increases as the equilibrium temperature increases in ESOP. In the engineering design, it is advised to strictly control the equilibrium temperature which is less than 240 K in the ESOP in order to relieve the structural failure of PFS.
The maximum equivalent stress of PFS increases with the equilibrium pressure in the ESOP. The brazed joint near fin is the main position of structural failure in different equilibrium pressure.
When the temperature difference is more than 5 K in the ESOP, the influence of that is obvious for the stress of PFS in LNG heat exchanger. Otherwise, it is slightly impacted by that. Therefore, it is advised to strictly control the temperature difference between HMR and LMR which is less than 5 K in the ESOP. Meanwhile, the structural failure of PFS induced by the temperature difference between HMR and LMR may be occurred at the brazing seam and is the interactional result between the direct stress and shear stress.
Acknowledgments
The authors are grateful for the support of National Natural Science Foundation (51808275) and Natural Science Foundation of Gansu Province (1606RJZA059 and 1508RJZA109).
References
- Jiang W.C., Gong J.M., Tu S.D., Fan Q.S. (2009) A comparison of brazed residual stress in plate-fin structure made of different stainless steel, Mater. Des. 30, 1, 23–27. [CrossRef] [Google Scholar]
- Peng H., Ling X. (2008) Optimal design approach for the plate-fin heat exchangers using neural networks cooperated with genetic algorithms, Appl. Therm. Eng. 28, 5–6, 642–650. [CrossRef] [Google Scholar]
- Chaker M., Meher-Homji C.B., Pillai P., Bhattacharya D., Messersmith D. (2015) Application of boil off gas compressors in liquefied natural gas plants, J. Eng. Gas Turb. Power-Trans. ASME 137, 4, 041702. [CrossRef] [Google Scholar]
- Jiang W.C., Gong J.M., Chen H., Tu S.T. (2008) The effect of filler metal thickness on residual stress and creep for stainless-steel plate-fin structure, Int. J. Pres. Ves. Piping 85, 8, 569–574. [CrossRef] [Google Scholar]
- Liu J.C., Zhang S.Y., Zhao X.Y., Yi G.D., Zhou Z.Y. (2015) Influence of fin arrangement on fluid flow and heat transfer in the inlet of a plate-fin heat exchanger, J. Zhejiang Univ.-Sci. A 16, 4, 279–294. [CrossRef] [Google Scholar]
- Chang K.H., Lee C.H. (2007) Residual stresses and fracture mechanics analysis of a crack in welds of high strength steels, Eng. Fract. Mech. 74, 6, 980–994. [CrossRef] [Google Scholar]
- Jiang W.C., Chen H., Gong J.M., Tu S.T. (2011) Numerical modelling and nanoindentation experiment to study the brazed residual stresses in an X-type lattice truss sandwich structure, Mater. Sci. Eng. A-Struct. Mater. Prop. Microstruct. Process. 528, 13–14, 4715–4722. [CrossRef] [Google Scholar]
- Jiang W.C., Zhang Y.C., Woo W. (2012) Using heat sink technology to decrease residual stress in 316L stainless steel welding joint: Finite element simulation, Int. J. Pres. Ves. Piping 92, 56–62. [CrossRef] [Google Scholar]
- Chen H., Gong J., Geng L., Tu S.T. (2005) Finite element prediction of residual stresses and thermal distor-tion in a brazed plate-fin structure, J. Pres. Equip. Syst. 3, 118–124. [Google Scholar]
- Xie Q.Y., Ling X.A. (2010) Numerical analysis of residual stress for copper base brazed stainless steel plate-fin structure, J. Mater. Eng. Perform. 19, 5, 611–615. [CrossRef] [Google Scholar]
- Jiang W.C., Gong J.M., Tu S.T., Chen H. (2009) Modelling of temperature field and residual stress of vacuum brazing for stainless steel plate-fin structure, J. Mater. Process. Technol. 209, 2, 1105–1110. [CrossRef] [Google Scholar]
- Jiang W.C., Wang B.Y., Gong J.M., Tu S.T. (2011) Finite element analysis of the effect of welding heat input and layer number on residual stress in repair welds for a stainless steel clad plate, Mater. Des. 32, 5, 2851–2857. [CrossRef] [Google Scholar]
- Ma H.Q., Hou C.Q., Yang R.X., Li C.E., Ma B.S., Ren J.Q., Liu Y.M. (2016) The influence of structure parameters on stress of plate-fin structures in LNG heat exchanger, J. Nat. Gas Sci. Eng. 34, 85–99. [CrossRef] [Google Scholar]
- Ma H.Q., Chen J., Cai W.H., Shen C., Yao Y., Jiang Y.Q. (2015) The influence of operation parameters on stress of plate-fin structures in LNG heat exchanger, J. Nat. Gas Sci. Eng. 26, 216–228. [CrossRef] [Google Scholar]
- Ma H.Q., Cai W.H., Zheng W.K., Chen J., Yao Y., Jiang Y.Q. (2014) Stress characteristics of plate-fin structures in the cool-down process of LNG heat exchanger, J. Nat. Gas Sci. Eng. 21, 1113–1126. [CrossRef] [Google Scholar]
- Salehi S., Afshin H., Farhanieh B. (2015) Numerical investigation of the inlet baffle, header geometry, and triangular fins effects on plate-fin heat exchangers performance, Heat Transf. Eng. 36, 16, 1397–1408. [CrossRef] [Google Scholar]
- Li Y., Li Y.X., Hu Q.H., Wang W.C., Xie B., Yu X.C. (2015) Sloshing resistance and gas-liquid distribution performance in the entrance of LNG plate-fin heat exchangers, Appl. Therm. Eng. 82, 182–193. [CrossRef] [Google Scholar]
All Tables
Geometric structure parameters (from No. 1 to No. 5 are defined from the bottom plate to tops).
All Figures
|
Fig. 1 The NG liquefaction process in liquefied heat exchanger. |
| In the text | |
|
Fig. 2 The diagram of relationship between the pressure and temperature of MR (LMR and HMR) and the operation time in the ESOP. |
| In the text | |
|
Fig. 3 The diagram of PFS. d is Plate thickness; h, Fin height; L, Effective length; f, Fin thickness; and g, Fin width |
| In the text | |
|
Fig. 4 The model of PFS and local structures. (a) The model of brazed structure. (b) The local structure in brazed joint (region 2). |
| In the text | |
|
Fig. 5 The relationship between the maximum equivalent stress and operation time at different hLMR. |
| In the text | |
|
Fig. 6 The relationship between the maximum equivalent stress and operation time at different hHMR. |
| In the text | |
|
Fig. 7 The relationship between the maximum equivalent stress and operation time at different Tb. |
| In the text | |
|
Fig. 8 The equivalent stress along path 3 in region 2 at different Tb. |
| In the text | |
|
Fig. 9 The stress along path 3 in region 2 at different Tb. (a) The direct stress along x direction. (b) The direct stress along y direction. (c) The direct stress along z direction. (d) The shear stress on x-y plane. |
| In the text | |
|
Fig. 10 The relationship between the maximum equivalent stress and operation time at different Pb. |
| In the text | |
|
Fig. 11 The equivalent stress along path 3 in region 2 at different Pb. |
| In the text | |
|
Fig. 12 The stress along path 3 in region 2 at different Pb. (a) The direct stress along x direction. (b) The direct stress along y direction. (c) The direct stress along z direction. (d) The shear stress on x-y plane. |
| In the text | |
|
Fig. 13 The relationship between the maximum equivalent stress and operation time at different ΔT. |
| In the text | |
|
Fig. 14 The equivalent stress along path 3 in region 2 at different ΔT. |
| In the text | |
|
Fig. 15 The stress along path 3 in region 2 at different ΔT. (a) The direct stress along x direction. (b) The direct stress along y direction. (c) The direct stress along z direction. (d) The shear stress on x-y plane. |
| In the text | |
|
Fig. 16 The relationship between the maximum equivalent stress and operation time at different HMR pressure. |
| In the text | |
|
Fig. 17 The equivalent stress along path 3 at different PHMR. |
| In the text | |
|
Fig. 18 The stress along path 3 in region 2 at different PHMR. (a) The direct stress along x direction. (b) The direct stress along y direction. (c) The direct stress along z direction. (d) The shear stress on x–y plane. |
| In the text | |