Fig. 11.
Download original image
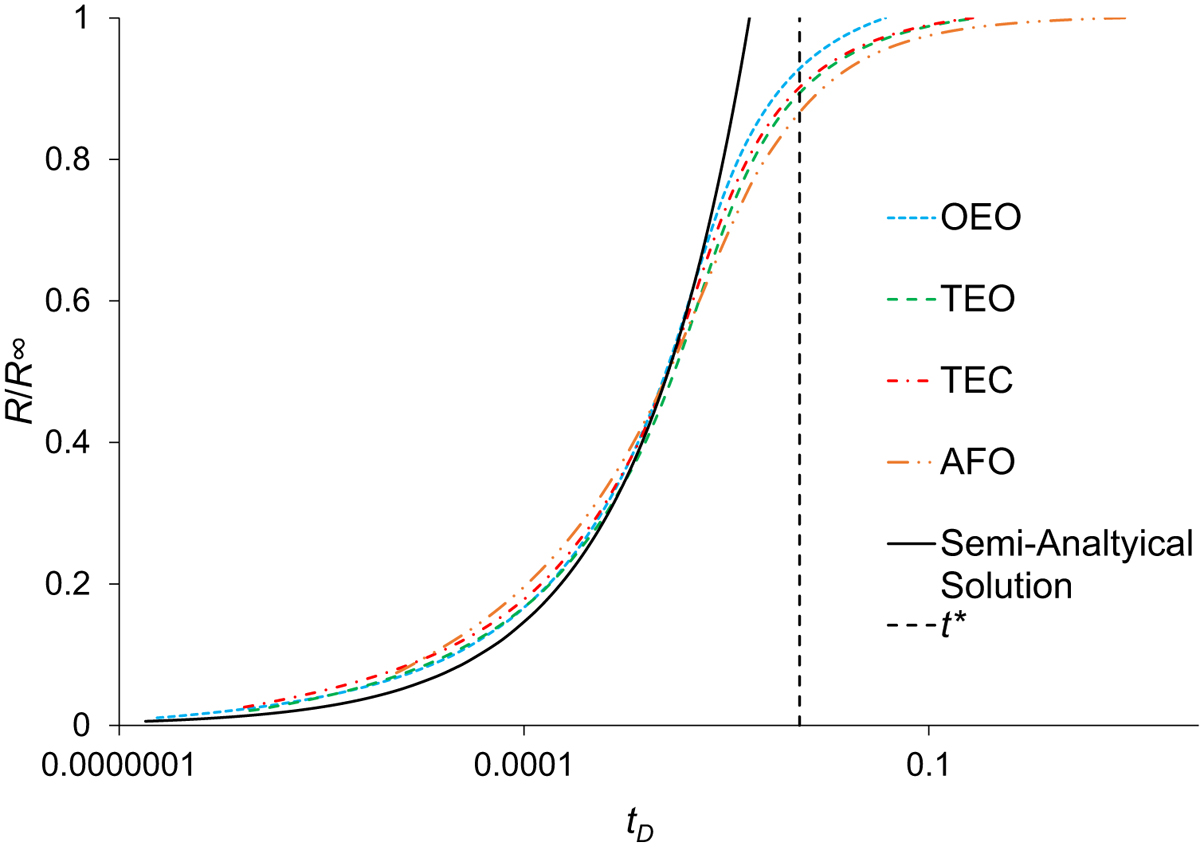
The plot shows normalized oil recovery factor and is plotted against time. Time is scaled according to Schmid and Geiger (2012) model resulting in the data to collapse into one curve on a semi-log scale. The scatter of the data is reasonable and within the range of the semi-analytical solution as can be seen in the plot. The semi-analytical solution is valid as long as the dimensionless time satisfies the condition tD < tD* presented in the introduction earlier. Although the oil flow in the AFO case is considerably faster compared to the other cases, the results still converge into almost a single curve.