Regular Article
The influence of residual stress for the strength of plate-fin structures in the typical operation process of Liquefied Natural Gas (LNG) heat exchanger
1
School of Civil Engineering and Architecture, East China Jiaotong University, Nanchang 330013, China
2
School of Civil Engineering, Lanzhou University of Technology, Lanzhou 730050, China
3
Department of Energy Engineering, Hebei University of Architecture, Zhangjiakou 075000, China
* Corresponding author: This email address is being protected from spambots. You need JavaScript enabled to view it.
Received:
2
July
2021
Accepted:
10
November
2021
Abstract
In order to ensure the safe operation of heat exchangers in the Liquefied Natural Gas (LNG), the stress analysis model of aluminum Plate-Fin Structure (PFS) is established based on the thermal-elastic-plasticity theory. The residual stress distribution of PFS and its influence on the structural strength is analyzed by the thermal-structural coupling method. The results indicate that the residual stress distribution of PFS is very complex, and the residual stress reaches the peak at the Brazed Joint (BJ). Due to the equivalent stress at BJ near the fin is higher than that at BJ near the plate, cracks are more easily produced at BJ near the fin. Therefore, the existence of residual stress has a negative impact on PFS, which may increase the possibility of strength failure at BJ under the typical operating conditions (normal operation, cut-down and heat-up) of the heat exchanger. In addition, the residual stress gradually decreases with the brazing cooling rate decrease. The residual stress within the PFS will be effectively reduced by properly reducing the brazing cooling rate, which can slow down the strength failure of the PFS. The above research results will provide an important basis for the design and safe operation of the aluminum plate-fin heat exchanger.
© H. Ma et al., published by IFP Energies nouvelles, 2021
 This is an Open Access article distributed under the terms of the Creative Commons Attribution License (https://creativecommons.org/licenses/by/4.0), which permits unrestricted use, distribution, and reproduction in any medium, provided the original work is properly cited.
1 Introduction
The aluminum Plate-Fin Structure (PFS) is the core component of natural gas liquefaction plant heat exchangers, and residual stresses are generated during the brazing process [1–3]. The brazing residual stress will be superimposed with the thermal stress of PFS during the actual operation process of the Liquefied Natural Gas (LNG) heat exchanger, which will intensify the stress concentration at the weak location of the PFS. Therefore, the existence of brazing residual stress will have a passive effect on the fatigue strength of PFS, which will eventually lead to strength failure of the PFS [4–6]. This will seriously affect the structural and operational safety of the LNG aluminum plate-fin heat exchanger [7].
At present, a lot of researches have been carried out about the residual stress characteristic of PFS. For example, the residual stress has been predicted by the finite element method. The peak residual stress occurs near the weld surface between the weld layer and the base material [8]. Due to the mechanical properties are incompletely matched between the base material and filler material, a large residual stress gradient will be generated near the interface between the base material and filler material. This will lead to the occurrence of peak residual stress [9]. The influence of different structure parameters and high temperature creep behavior on residual stress is analyzed by the finite element method. The filler metal thickness, brazing gap, plate thickness, fin thickness, fin pitch, and fin height are the main influence factors for the residual stress, and the high temperature creeps behavior greatly relieves the brazing residual stress at the brazed joint [10–12]. The influence of element diffusion on residual stress is studied by the microstructure method. The residual stress distribution at the diffusion affected zone is extremely complex under the influence of element diffusion. The local residual stress at the diffusion affected zone is higher than that at the filler material [13], etc. These studies are mainly focused on the brazing residual stress of stainless steel PFS and the influence of different factors on the brazing residual stress of that.
For the research on the influence of brazing residual stress on the strength of aluminum PFS was carried out under low temperature conditions. The influence of structure parameters, operation parameters, and emergency stop operation is analyzed for the strength of PFS in the LNG heat exchanger. Therefore, the main effect factors are determined for the strength failure of the plate-fin structure [14–16]. Furthermore, the influence of structure parameters is quantitatively analyzed for the stress distribution of serrated-fin structure under cryogenic conditions. The serrated-fin structure is comprehensively optimized on this basis [17, 18]. In addition, the stress characteristics of PFS are investigated under the cool-down and heat-up process of the LNG heat exchanger. The optimum operation method is proposed during the cool-down and heat-up process [19–21]. However, these studies are based on thermal-elastic theory. The influence of plastic deformation and brazing residual stress on the strength of PFS are not considered in the actual operation process of heat exchangers.
In this paper, the stress characteristics analysis model of PFS is established based on the thermal-elastic-plasticity theory. The brazing residual stress distribution of PFS and the influence of brazing residual stress on the PFS strength during typical operation are analyzed by the thermal-structure coupling method. In the analysis, the brazing residual stress is loaded into the PFS of LNG heat exchanger as a body load. In addition, the influence of different brazing cooling rates is investigated for the residual stress of that, and an effective method is proposed to decrease the residual stress.
2 Finite element analysis
2.1 Description of the Model
As shown in Figure 1, the Natural Gas (NG) and Mixed Refrigerant (MR) are alternately countercurrents in the actual operation process. The structure is repetitive and periodic for PFS of the LNG heat exchanger. Therefore, only the vertical section with the four layer fins of one period length (Fig. 1 in the dotted line) is adopted to analyze the influence of residual stress on the PFS strength in the typical operation process. In this analysis, a smaller section is used in the direction of length L because the temperature gradient is very small along the length L of the PFS. Figure 2 depicts a simplified model. The model structure parameters are shown in Table 1.
 |
Fig. 1 Schematic diagram of PFS in LNG heat exchanger. |
 |
Fig. 2 The PFS as a simplified model. |
Structural parameters of plate-fin model (from bottom layer to top layer).
In the petrochemical industry, AL3003 and AL4004 are widely used as the fins and plates of aluminum PFS and as the Brazing Filler Metal Layer (BFML) in LNG heat exchanger, respectively. Therefore, it is assumed that the fin and plate materials are AL3003, the BFML is AL4004. Meanwhile, the temperature has a significant influence on the thermal expansion coefficient, elastic modulus and yield strength of materials AL3003 and AL4004. While the density, thermal conductivity and specific heat are less affected by temperature. In order to simplify the calculation model, only the influence of temperature for the elasticity modulus, thermal expansion coefficient and yield strength are considered in AL3003 and AL4004. The influence of temperature was neglected for the density, thermal conductivity and specific heat. The simplified mechanical property parameters of PFS are shown in Table 2.
Mechanical properties of materials.
2.2 Analysis strategy
The strength of PFS is influenced by the combined effect of brazing residual stress, external force and temperature field during the actual operation process of the LNG heat exchanger. Using finite element software, the residual stress in PFS will be simulated, which is produced in the brazing process. Then the influence of residual stress which is as the body load is analyzed for the strength of PFS in the LNG heat exchanger. For the residual stress analysis of PFS in the LNG heat exchanger, the fixed constraint boundary in the y-direction is applied on the bottom surface of that. At the meantime, the fixed constraint boundary in the y-direction is also applied on the top surface of PFS, which is used to simulate the force by jig. The radiative heat transfer boundary in the cavity of PFS is adopted to simulate the radiation heat transfer inside the PFS during the brazing process. The temperature curve corresponding to the radiation heat transfer boundary of PFS during the brazing process can be expressed as the following relationship: (1)
(1)
In equation (1), T BF is the brazing furnace temperature, K, t is the brazing time, min. Simultaneously, the symmetrical boundary conditions are applied to the left and right sides of PFS to simulate the repeatability and symmetry of PFS.
For the purpose of determining the impact of brazing residual stress on the strength of LNG heat exchanger PFS, the convective heat transfer boundary is applied to simulate the heat transfer between NG (MR) and PFS [22]. The adiabatic boundary is used on the left and right sides to simulate the heat transfer symmetry of PFS. The influence of NG (MR) pressure on the strength of PFS is simulated by the pressure boundary between the NG (MR) and that. A fixed constraint of the y-direction is applied to the bottom of the plate. Simultaneously, the brazing residual stress is loaded into the internal nodes of PFS to simulate the influence of residual stress on the strength of PFS by the pre-stress analysis method. The detailed boundary conditions are shown in Figure 3.
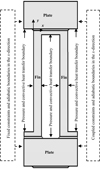 |
Fig. 3 The boundary conditions of PFS on the thermal stress analysis during the actual operation process. |
2.3 Grid division and grid irrelevance verification
In this paper, the PFS are meshed by the structured grids. Four grids of 34,000, 75,000, 142,000, and 286,000 nodes are selected to simulate the stress characteristic of PFS at the same calculation conditions. The simulation results and deviations are shown in Table 3. The results show that the calculation results on the stress of PFS are slightly impacted by the number of grid nodes when the number of grid nodes is larger than 142,000. Therefore, the grid with 142,000 nodes is finally used to analysis the stress characteristic of PFS in the LNG heat exchanger.
The calculation results and deviations at different grid nodes.
3 Results and discussion
3.1 The residual stress distribution of PFS
Cracks and fractures are most likely to occur at the interface between BFML and plate or fin, as well as the brazed joint (BJ). As a result, four paths are selected to evaluate the residual stress distribution of PFS during the brazing process, as shown in Figure 2. Path 1 and Path 2 are located at the interface between the BFML and the plate, and between the fin and the BFML, respectively. Path 3 is along with the fin height and through the BJ (Region 2) and the BFML (Region 3). Path 4 is along with the interface between the plate and the BFML and through the BJ (Regions 4 and 5) and flow channel. This will be shown in Figure 2.
Figures 4 and 5 show the residual stress distribution along Path 1 and Path 2, respectively. In this paper, σ and τ represent normal and shear stress, respectively. The subscript indicates the direction of the normal stress and shear stress. σ r is the equivalent stress. The results show that the residual stress reaches the peak value at BJ (Regions 1 and 2). Because of the structural mutation at the BJ and the material performance mismatch between plate or fin and BFML, the gradient of residual stress at this location is significantly higher than at other locations. The normal and the equivalent stress are distributed symmetrically along Path 1 and Path 2. The normal stress in the y-direction is significantly larger than that in the other directions. The equivalent stress reaches the minimum value in the middle of BFML. The shear stress in the x-y plane is distributed asymmetrically, and the shear stresses in other planes are approximately equal to zero along Path 1 and Path 2.
 |
Fig. 4 Residual stress distribution along Path 1. |
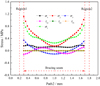 |
Fig. 5 Residual stress distribution along Path 2. |
The equivalent stress at BJ near the fin is greater than that at BJ near the plate according to the comparison of Figures 4 and 5. The normal stress in the y-direction is significantly greater than in the other directions. As a result, cracks are more likely to occur at BJ near the fin, and the normal stress in the y-direction may be the primary cause.
To further analyze the distribution of residual stress at BJ, the residual stress in Region 2 along Path 3 is shown in Figure 6. The results indicate that along Path 3, the residual stress in the fin and plate are approximately constant, the normal and shear stress at BJ is approximately linear. The shear stress in the y-z and x-z planes is approximately equal to zero along Path 3. The equivalent stress, normal stresses and shear stress in the x-y plane are mutational at the interface between the BFML and the plate and at the interface between the fin and the BFML. Simultaneously, the normal stress in the y-direction is significantly larger than in the other stresses. The equivalent stress of BJ near the fin is larger than that of BJ near the plate, which is consistent with the above conclusion.
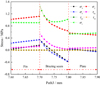 |
Fig. 6 Residual stress distribution of local position in Region 2 along Path 3. |
Figure 7 is the distribution of residual stress at Region 3 along Path 3. The results indicate that the equivalent stress, the normal stress in the x- and z-direction at BFML are larger than the equivalent stress, the normal stress in the x- and z-direction at the plate and the fin. The other stresses are approximately constant at Region 3 along Path 3.
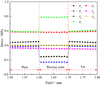 |
Fig. 7 Residual stress distribution of local position in Region 3 along Path 3. |
Figure 8 is the distribution of residual stress along Path 4. The results show that the residual stress reaches the peak value at BJ (Region 4 and Region 5). The gradient of residual stress at this location is relatively higher than that at the other location due to the structural mutation at BJ and the material performance mismatch between the plate or the fin and the BFML. The normal and equivalent stress are distributed symmetrically along Path 4, the shear stress in the x-y plane is distributed asymmetrically, and the shear stress in other planes are approximately equal to zero. The normal stress in the y-direction is significantly larger than that in the other directions.
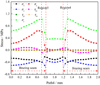 |
Fig. 8 Residual stress distribution along Path 4. |
In summary, for the PFS in the LNG heat exchanger, the residual stresses distribution is very complicated and reaches the peak value at BJ. The gradient of residual stress at BJ is relatively larger than that at the other location. The normal stress in the y-direction is significantly higher than that in the other directions. The equivalent stress at BJ near the fin is larger than that at BJ near the plate. Therefore, cracks are more easily to occur at BJ near the fin due to the existence of the residual stress.
3.2 The influence of brazing residual stress for the strength of PFS
The normal operation, cool-down and heat-up processes for the heat exchanger in a large-scale LNG plant are all part of the actual operation process. As a result, the impact of brazing residual stress on the strength of PFS is investigated in this section under these three typical operating conditions.
3.2.1 The influence of residual stress in the normal operation process
Under the design conditions of a large-scale LNG plant heat exchanger, the NG is cooled at a pressure of P NG = 7.1 MPa, a heat transfer coefficient of h NG = 1.5 kW/(m2 K) between the NG and PFS, and a temperature difference of ΔT = 5 K between NG and MR. The MR is heated at a pressure P MR = 0.4 MPa, a heat transfers coefficient of h MR = 1.0 kW/(m2 K) between the MR and PFS, and a temperature T MR = 150 K. Therefore, the influence of residual stress on the strength of PFS in the LNG heat exchanger is analyzed at the above parameters sets. And the stress distributions of PFS considering the residual stress in the brazing process are compared with that without considering the residual stress in the brazing process.
Figures 9 and 10 are the comparisons of stress distribution for Path 1 and Path 2 in the normal operation process (the subscript y or n indicates with or without residual stress, respectively). The results indicate that the shear stress in the x-y plane is distributed asymmetrically along Path 1 and Path 2, the shear stress in the y-z and x-z plane are approximately equal to zero along Path 1 and Path 2, and the normal stresses and equivalent stress are distributed symmetrically along Path 1 and Path 2. The stress gradient near the BJ (Regions 1 and 2) is much larger than that in other regions. By comparing Figure 9 and Figure 10, it can be seen that the equivalent stress of BJ near the fin is larger than that of BJ near the plate. The existence of residual stress will lead to the increase of the equivalent stress. From Figure 9, it can also be seen that the stress distribution of BJ is complicate during the normal operation of the heat exchanger. Both the normal stresses and equivalent stress reach the peak value at BJ, the normal stress in the x- and z-directions are relatively larger compared with other stresses. From Figure 10, it can also be seen that the normal stress in the y-direction and the equivalent stress are relatively larger and reach the peak value at BJ, while other stresses are relatively small. Consequently, the normal stress in the x- and z-directions may be the major factor to impact the strength failure of the interface between the BFML and the plate. The normal stress in the y-direction may be the major factor to impact the strength failure of the interface between the BFML and the fin. The existence of residual stress has a passive influence on the heat exchanger and may increase the stress strength failure at BJ.
 |
Fig. 9 The comparison of stress distributions of Path 1 in the normal operation process. |
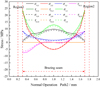 |
Fig. 10 The comparison of stress distributions of Path 2 in the normal operation process. |
In order to further determine the main influence factors of structure failure at BJ, the stress distribution at region 3 along Path 3 was analyzed, as shown in Figures 11 and 12. From Figure 11, it can be shown that the normal stress in the x-and z-directions and the equivalent stress approach the peak value in BFML, and the other stresses are approximately equal to zero in BFML, which means that the strength failure in BFML is primarily caused by the normal stress in the x- and z-directions. From Figure 12, it can be seen that the stress gradient of all stresses at the BJ (Region 4 and Region 5) is large, the normal stress in the x- and z-directions is larger than other stresses. Comparing Figure 11 and Figure 12, it can also be seen that the existence of residual stress will lead to the increase of equivalent stress and other stresses.
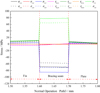 |
Fig. 11 The comparison of stress distribution of local position in Region 3 of Path 3. |
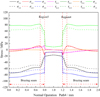 |
Fig. 12 The comparison of stress distributions of Path 4 |
In conclusion, during the normal operation of the aluminum plate-fin heat exchanger, the stress distribution of BJ is complex, the equivalent stress of BJ near the fin is larger than that of BJ near the plate. Therefore, the BJ near the fin is more prone to strength failure. The normal stress in the x-and z-directions may be the main reason for the strength failure of the BJ near the plate and the BFML. The normal stress in the y-direction may be the main reason for the strength failure of BJ near the fin and the BFML. The existence of residual stress has a passive influence on the heat exchanger and may increase the possibility of strength failure at BJ.
3.2.2 The influence of residual stress in the cool-down process
When the temperature difference between NG and MR is constant during the cool-down process, the stress characteristic of PFS is slightly affected by the temperature drop rate, according to the literature [20, 21]. As a result, the impact of brazing residual stress on PFS stress is investigated at a temperature drop rate of T r = 2.5 K/min, convective heat transfer coefficients between NG or MR and PFS of h NG = 1.5 kW/(m2 K), h MR = 1.0 kW/(m2 K), NG or MR pressures of P NG = 7.1 MPa, P MR = 0.4 MPa and the temperature differential between MR and NG of ΔT = 5 K. The stress states are analyzed at the typical locations of PFS which are the Points 1–5 (As shown in Fig. 2). Point 1 and Point 2 are located at BJ near the fin and the plate, respectively. Point 3 is located in the center of BFML. Point 4 and Point 5 are located at the interface between the BFML and the plate, and between the fin and the BFML, respectively.
Figure 13 is the comparison results of stress states at Point 1 in the cool-down process. The results show that the equivalent stress, the normal stress in the y-and z-directions, the shear stress in the x-y plane will increase and other stresses are approximately equal to zero with the cool-down time at BJ near the fin. Meanwhile, the equivalent stress, and the normal stress in the z-direction are larger than other stresses. Therefore, the normal stress in the z-direction is the main factor to impact the strength failure of BJ near the fin during the cool-down time. Simultaneously, the equivalent stress is larger with residual stress than that without residual stress. So the existence of residual stress has a passive effect on the heat exchanger and maybe increases the strength failure at Point 1 of PFS during the cool-down time.
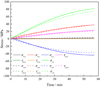 |
Fig. 13 The comparison results of stress states at Point 1 in the cool-down process. |
Figure 14 is the comparison results of stress states at Point 2 in the cool-down process. The results show that the equivalent stress, the normal stresses, the shear stress in the x-y plane will increase and other stresses are approximately equal to zero with the cool-down time at BJ near the plate. Meanwhile, the equivalent stress, and the normal stress in the z-direction are larger than other stresses. Consequently, the normal stress in the z-direction is the main factor to impact the strength failure of BJ near the plate during the cool-down time. Simultaneously, the equivalent stress is larger with residual stress than that without residual stress. So the existence of residual stress has a passive effect on the heat exchanger and maybe increases strength failure at Point 2 of PFS during the cool-down time.
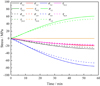 |
Fig. 14 The comparison results of stress states at Point 2 in the cool-down process. |
By comparing Figure 13 and Figure 14, it can be shown that the equivalent stress of BJ near the fin (Point 1) is larger than that of BJ near the plate (Point 2). Therefore, the BJ near the fin is more prone to strength failure during the cool-down time.
Figures 15–17 are the comparison results of stress states at points 3, 4, and 5 in the cool-down process. The results indicate that at the center of BFML (Point 3), the interface between the BFML and the plate (Point 4) and the interface between the BFML and the fin (Point 5) with the cool-down time, the equivalent stress, the normal stress in the x- and z-directions will increase, and the other stresses are approximately equal to zero. Meanwhile, the normal stress in the x-and z-directions are larger than other stresses. Consequently, the normal stress in the x- and z-direction are the main factors to impact the strength failure of BFML (points 3, 4, and 5) during the cool-down time. Simultaneously, the equivalent stress is larger with residual stress than that without residual stress. So the existence of residual stress has a passive effect on the heat exchanger and maybe increases the strength failure at points 3, 4, and 5 of PFS during the cool-down time.
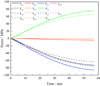 |
Fig. 15 The comparison results of stress states at Point 3 in the cool-down process. |
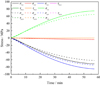 |
Fig. 16 The comparison results of stress states at Point 4 in the cool-down process. |
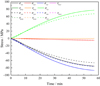 |
Fig. 17 The comparison results of stress states at Point 5 in the cool-down process. |
In conclusion, during the cool-down of the aluminum plate-fin heat exchanger, the stress distribution of BFML is complex, the PFS is more prone to strength failure at BJ near the fin. The normal stresses are the main factor to impact the strength failure of BJ. The existence of residual stress has a passive effect on PFS and maybe accelerates the strength failure of PFS during the cool-down process.
3.2.3 The influence of residual stress in the heat-up process
When the temperature difference between NG and MR is constant during the heat-up process, the temperature change rate has a slight effect on PFS stress. Consequently, the impact of residual stress on PFS strength at a temperature change rate of T r = 2.5 K/min, the convective heat transfer coefficients between NG or MR and PFS h NG = = 1.5 kW/(m2 K), h MR = 1.0 kW/(m2 K), the NG or MR pressures P NG = 7.1 MPa, P MR = 0.4 MPa and the temperature difference between NG and MR ΔT = 5 K are investigated.
Figure 18 is the comparison results of stress states at Point 1 in the heat-up process. The results show that the equivalent stress, the normal stress in the y- and z-directions, the shear stress in the x-y plane will decrease and other stresses are approximately equal to zero with the heat-up time at BJ near the fin. Meanwhile, the normal stress in the z-direction is larger than other stresses. Therefore, the normal stress in the z-direction is the main factor to impact the strength failure of BJ near the fin during the heat-up time. Simultaneously, the equivalent stress is larger with residual stress than that without residual stress. So the existence of residual stress has a passive effect on the heat exchanger and maybe increases the strength failure at Point 1 of PFS during the heat-up time.
 |
Fig. 18 The comparison results of stress states at Point 1 in the heat-up process. |
Figure 19 is the comparison results of stress states at Point 2 in the heat-up process. The results indicate that the equivalent stress, the normal stresses, the shear stress in the x-y plane will decrease and other stresses are approximately equal to zero with the heat-up time at BJ near the plate. Meanwhile, the normal stress in the z-direction is larger than other stresses. Consequently, the normal stress in the z-direction is the main factor to impact the strength failure of BJ near the plate during the heat-up time. Simultaneously, the equivalent stress is larger with residual stress than that without residual stress. So the existence of residual stress has a passive effect on the heat exchanger and maybe increases the strength failure at Point 2 of PFS during the heat-up time.
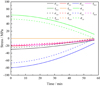 |
Fig. 19 The comparison results of stress states at Point 2 in the heat-up process. |
By comparing Figure 18 and Figure 19, it can be shown that the equivalent stress of BJ near the fin (Point 1) is greater than that of BJ near the plate (Point 2). Consequently, the BJ near the fin is more prone to strength failure during the heat-up time.
Figures 20–22 are the comparison results of stress states at points 3, 4, and 5 in the heat-up process. The results indicate that the equivalent stress, the normal stress in the x-and z-directions will decrease and other stresses are approximately equal to zero with the heat-up time at the center of BFML (Point 3), the interface between the BFML and the plate (Point 4), the interface between the BFML and the fin (Point 5). Moreover, the equivalent stress, the normal stress in the x- and z-directions are larger than other stresses. Consequently, the normal stress in the x- and z-directions are the main factor to impact the strength failure of BFML (points 3–5) during the heat-up time. Simultaneously, the equivalent stress is larger with residual stress than that without residual stress. So the existence of residual stress has a passive effect on the heat exchanger and maybe increases the strength failure at points 3–5 of PFS during the heat-up time.
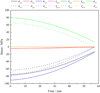 |
Fig. 20 The comparison results of stress states at Point 3 in the heat-up process. |
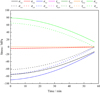 |
Fig. 21 The comparison results of stress states at Point 4 in the heat-up process. |
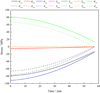 |
Fig. 22 The comparison results of stress states at Point 5 in the heat-up process. |
In conclusion, during the heat-up of the aluminum plate-fin heat exchanger, the stress distribution of BFML is complex. The PFS is more prone to strength failure at BJ near the fin. The normal stresses are the main factor to impact the strength failure of BJ. The existence of residual stress has a passive effect on PFS and maybe accelerates the strength failure of PFS during the heat-up process.
3.3 Influence of brazing cooling rate on residual stress of PFS
From the above analysis, it can be seen that residual stress will be generated in the brazing process of PFS, and the existence of residual stress has a passive effect on the strength of PFS and maybe accelerates the strength failure of PFS. The influence of different brazing cooling rates on the residual stress is investigated in this section and an effective method is proposed to decrease the residual stress, which purpose is to reduce the influence of residual stress on the structural strength.
3.3.1 Brazing process of PFS
Figure 23 shows the temperature control curve of vacuum brazing furnaces under different brazing cooling rates. It can be seen that the temperature change of the whole brazing process has undergone 10 processes: (a) The brazing temperature increased from room temperature 298 K to 633 K after 30 min of heat. (b) Keep the heat for 50 min at 633 K. (c) The brazing temperature increased from 633 K to 743 K after 25 min of heat. (d) Keep the heat for 8 min at 743 K. (e) After 15 min of heat, the brazing temperature increased from 743 K to 843 K. (f) Keep the heat for 9 min at 843 K. (g) After 8 min of heat, the brazing temperature increased from 843 K to 863 K. (h) Under the environmental conditions of 863 K, after 4 min of heat preservation, the BFML is fully diffused to form a BJ. (i) The brazing furnace is filled with nitrogen and shock cool, so that the temperature in the vacuum furnace is reduced from 863 K to 373 K. (j) After 60 min of natural cool, the temperature of PFS was finally restored to room temperature of 298 K.
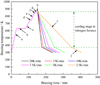 |
Fig. 23 Temperature control curve of vacuum brazing furnace under different brazing cooling rate. |
3.3.2 Residual stress under different brazing cooling rates
Figures 24–26 show that the residual stress distribution comparison of Path 1, Path 2 and Path 4 for different brazing cooling rates (20 K/min, 15 K/min, 10 K/min, 7.5 K/min, 5 K/min and 2.5 K/min) in the brazing stage (i). It can be shown from the figure that the residual stress under different brazing cooling rates in the brazing stage (i) are distributed symmetrically along Path 1, Path 2 and Path 4 and all reach the peak value at the BJ. With the decrease of brazing cooling rate, the residual stress decreases gradually. Therefore, the residual stress inside the PFS can be reduced effectively by appropriate reduction of the brazing cooling rate to slow down the strength failure of PFS.
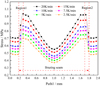 |
Fig. 24 The residual stress distributions comparison of Path 1 at different brazing cooling rates in the brazing stage (i). |
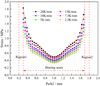 |
Fig. 25 The residual stress distributions comparison of Path 2 at different brazing cooling rates in the brazing stage (i). |
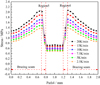 |
Fig. 26 The residual stress distributions comparison of Path 4 at different brazing cooling rates in the brazing stage (i). |
4 Conclusion
In this paper, a stress analysis model is established to analyze the stress characteristics of LNG aluminum PFS. The residual stress distribution and influence of that for the strength of PFS is analyzed by the thermal-structural coupling method. And a method is proposed to effectively decrease the residual stress. From this research, the following conclusions can be obtained.
-
The residual stress distribution in BJ of PFS is very complex. The normal stress in the y-direction plays a dominant role at BJ. Due to the structural mutation at BJ and the material performance mismatch between the plate or fin and the BFML, cracks are easy to be induced by the residual stress at BJ near the fin.
-
In the normal operation process, the normal stress in the x-and z-directions may be the main factor for the strength failure of BJ near the plate and the BFML, and the normal stress in the y-direction may be the main factor for the strength failure of BJ near the fin and the BFML. In the cool-down and heat-up process, the normal stresses are the main factors for the strength failure of BJ.
-
The equivalent stress of BJ near the fin is higher than that near the plate, so the BJ near the fin is more prone to strength failure. The existence of residual stress will increase the possibility of strength failure of BJ.
-
The residual stress decreases with the brazing cooling rate decrease. Without considering the time cost, the manufacturer appropriately prolongs the time of the nitrogen shock cooling stage, and adopts a smaller brazing cooling rate that can reduce the residual stress inside PFS. This can slow down the strength failure of PFS and achieve the purpose to prolong the life of the heat exchanger.
Acknowledgments
This project is supported by National Natural Science Foundation (51808275), Natural Science Foundation of Gansu Province (1606RJZA059) and Postdoctoral Science Foundation of China (2018M643768) and Institutions of higher learning scientific research projects from Hebei Province Education Department in 2016 (No: QN2016210). The author expresses his thanks here.
References
- Liu Y., Tsang K.S., Subramaniam N.A., Pang J.H.L. (2021) Structural fatigue investigation of thermite welded rail joints considering weld-induced residual stress and stress relaxation by cyclic load, Eng. Struct. 235, 112033. [CrossRef] [Google Scholar]
- Ma H.Q., Liu Y.M., Hou C.Q., Wang G., Luo X.M. (2020) Numerical investigation on the thermal-flow performance of humid air-water in the interspace outside staggered tube bundles, Int. J. Heat Mass Trans. 166, 120784. [Google Scholar]
- Hightower M., Gritzo L., Luketa-Hanlin A., Covan J., Tieszen S., Wellman G., Irwin M., Kaneshige M., Melof B., Morrow C., Ragland D. (2004) Guidance on risk analysis and safety implications of a Large Liquefied Natural Gas (LNG) spill over water, Sandia National Laboratories. [Google Scholar]
- Ramakokovhu U., Desai D., Snedden G., Jamiru T. (2020) Significance of residual stresses in fatigue life prediction of micro gas turbine blades. Eng. Fail. Anal. 120, 105092. [Google Scholar]
- Gan C.L., Zhou N., Kang Y.H., Wang S.C., Zheng K.H. (2019) Failure analysis of lead-free brass valve bodies, Eng. Fail. Anal. 100, 536–543. [CrossRef] [Google Scholar]
- Manai A., Polach R.U.F.V.B.U., Al-Emrani M. (2020) A probabilistic study of welding residual stresses distribution and their contribution to the fatigue life, Eng. Fail. Anal. 118, 104787. [CrossRef] [Google Scholar]
- Chen H., Gong J.M., Geng L.Y., Tu S.T. (2006) Numerical analysis of thermal deformation and residual stress for the brazed plate-fin structure, in: ASME 2006 Pressure Vessels and Piping/ICPVT-11 Conference, July 23–27, 2006, Vancoucer, BC, Canada. [Google Scholar]
- Xu S.G., Wang W.Q. (2013) Numerical investigation on weld residual stresses in tube to tube sheet joint of a heat exchanger, Int. J. Press. Vessels Pip. 101, 37–44. [CrossRef] [Google Scholar]
- Gong J.M., Jiang W.C., Fan Q.S., Chen H., Tu S.T. (2009) Finite element modelling of brazed residual stress and its influence factor analysis for stainless steel plate-fin structure, J. Mater. Process. Technol. 209, 1635–1643. [CrossRef] [Google Scholar]
- Jiang W.C., Gong J.M., Chen H., Tu S.T. (2008) The effect of filler metal thickness on residual stress and creep for stainless-steel plate–fin structure, Int. J. Press. Vessels Pip. 85, 569–574. [CrossRef] [Google Scholar]
- Jiang W.C., Gong J.M., Tu S.T., Chen H. (2008) Effect of geometric conditions on residual stress of brazed stainless steel plate-fin structure, Nucl. Eng. Des. 238, 1497–1502. [CrossRef] [Google Scholar]
- Jiang W.C., Gong J.M., Tu S.D., Chen H. (2009) Three-dimensional numerical simulation of brazed residual stress and its high-temperature redistribution for stainless steel plate-fin structure, Mater. Sci. Eng. A 499, 293–298. [CrossRef] [Google Scholar]
- Wei Z.Q., Jiang W.C., Song M., Xiao C.G., Tu S.T. (2018) Effects of element diffusion on microstructure evolution and residual stresses in a brazed joint: Experimental and numerical modeling – ScienceDirect, Materialia 4, 540–548. [CrossRef] [Google Scholar]
- Ma H.Q., Chen J., Cai W.H., Shen C., Yao Y., Jiang Y.Q. (2016) The influence of operation parameters on stress of plate-fin structures in LNG heat exchanger, J. Natural Gas Sci. Eng. 34, 85–99. [CrossRef] [Google Scholar]
- Ma H.Q., Hou C.Q., Yang R.X., Li C.E., Ma B.S., Ren J.Q., Liu Y.M. (2016) The influence of structure parameters on stress of plate-fin structures in LNG heat exchanger, J. Natural Gas Sci. Eng. 34, 85–99. [CrossRef] [Google Scholar]
- Ma H.Q., Song X.P., Liu Y.M., Liang N., Hou C.Q. (2020) Influence of emergency stop operation for strength of brazed structure with rectangular fins and plates in LNG heat exchanger, J. Press. Vessel Technol. 142, 031732. [Google Scholar]
- Li K., Wen J., Wang S., Li Y. (2020) Multi-parameter optimization of serrated fins in plate-fin heat exchanger based on fluid-structure interaction, Appl. Therm. Eng. 176, 115357. [CrossRef] [Google Scholar]
- Li K., Wen J., Yang H., Wang S., Li Y. (2019) Sensitivity and stress analysis of serrated fin structure in plate-fin heat exchanger on cryogenic condition, Int. J. Therm. Sci. 145, 115357. [Google Scholar]
- Ma H.Q., Cai W.H., Yao Y., Jiang Y.Q. (2016) Investigation on stress characteristics of plate-fin structures in the heat-up process of LNG heat exchanger, J. Natural Gas Sci. Eng. 30, 256–267. [CrossRef] [MathSciNet] [Google Scholar]
- Ma H.Q., Chen J., Cai W.H., Zheng W.K., Jiang Y.Q. (2015) Numerical investigation on stress of plate-fin structures during cool-down of LNG heat exchanger, Harbin Gongye Daxue Xuebao/J. Harbin Inst. Technol. 47, 21–26. [Google Scholar]
- Ma H.Q., Cai W.H., Zheng W.K., Chen J., Yao Y., Jiang Y.Q. (2014) Stress characteristics of plate-fin structures in the cool-down process of LNG heat exchanger, J. Natural Gas Sci. Eng. 21, 1113–1126. [CrossRef] [Google Scholar]
- Ma H.Q., Cai W.H., Chen J., Yao Y., Jiang Y.Q. (2016) Numerical investigation on saturated boiling and heat transfer correlations in a vertical rectangular minichannel, Int. J. Therm. Sci. 102, 285–299. [CrossRef] [Google Scholar]
All Tables
All Figures
|
Fig. 1 Schematic diagram of PFS in LNG heat exchanger. |
| In the text | |
|
Fig. 2 The PFS as a simplified model. |
| In the text | |
|
Fig. 3 The boundary conditions of PFS on the thermal stress analysis during the actual operation process. |
| In the text | |
|
Fig. 4 Residual stress distribution along Path 1. |
| In the text | |
|
Fig. 5 Residual stress distribution along Path 2. |
| In the text | |
|
Fig. 6 Residual stress distribution of local position in Region 2 along Path 3. |
| In the text | |
|
Fig. 7 Residual stress distribution of local position in Region 3 along Path 3. |
| In the text | |
|
Fig. 8 Residual stress distribution along Path 4. |
| In the text | |
|
Fig. 9 The comparison of stress distributions of Path 1 in the normal operation process. |
| In the text | |
|
Fig. 10 The comparison of stress distributions of Path 2 in the normal operation process. |
| In the text | |
|
Fig. 11 The comparison of stress distribution of local position in Region 3 of Path 3. |
| In the text | |
|
Fig. 12 The comparison of stress distributions of Path 4 |
| In the text | |
|
Fig. 13 The comparison results of stress states at Point 1 in the cool-down process. |
| In the text | |
|
Fig. 14 The comparison results of stress states at Point 2 in the cool-down process. |
| In the text | |
|
Fig. 15 The comparison results of stress states at Point 3 in the cool-down process. |
| In the text | |
|
Fig. 16 The comparison results of stress states at Point 4 in the cool-down process. |
| In the text | |
|
Fig. 17 The comparison results of stress states at Point 5 in the cool-down process. |
| In the text | |
|
Fig. 18 The comparison results of stress states at Point 1 in the heat-up process. |
| In the text | |
|
Fig. 19 The comparison results of stress states at Point 2 in the heat-up process. |
| In the text | |
|
Fig. 20 The comparison results of stress states at Point 3 in the heat-up process. |
| In the text | |
|
Fig. 21 The comparison results of stress states at Point 4 in the heat-up process. |
| In the text | |
|
Fig. 22 The comparison results of stress states at Point 5 in the heat-up process. |
| In the text | |
|
Fig. 23 Temperature control curve of vacuum brazing furnace under different brazing cooling rate. |
| In the text | |
|
Fig. 24 The residual stress distributions comparison of Path 1 at different brazing cooling rates in the brazing stage (i). |
| In the text | |
|
Fig. 25 The residual stress distributions comparison of Path 2 at different brazing cooling rates in the brazing stage (i). |
| In the text | |
|
Fig. 26 The residual stress distributions comparison of Path 4 at different brazing cooling rates in the brazing stage (i). |
| In the text | |