Fig. 2
Download original image
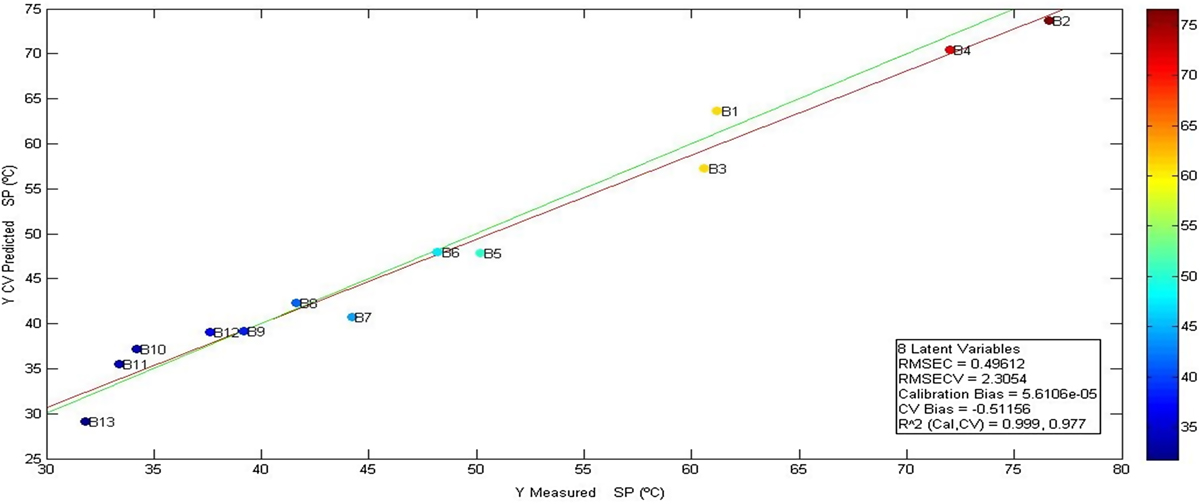
Comparison between the measured values of SP and the calculated ones from cross-validation using FT-IR data (the green line is the perfect fit line while the red one is the model-fit line – samples are colored based on SP values – colors are represented on the color grid on the right).