Fig. 8
Download original image
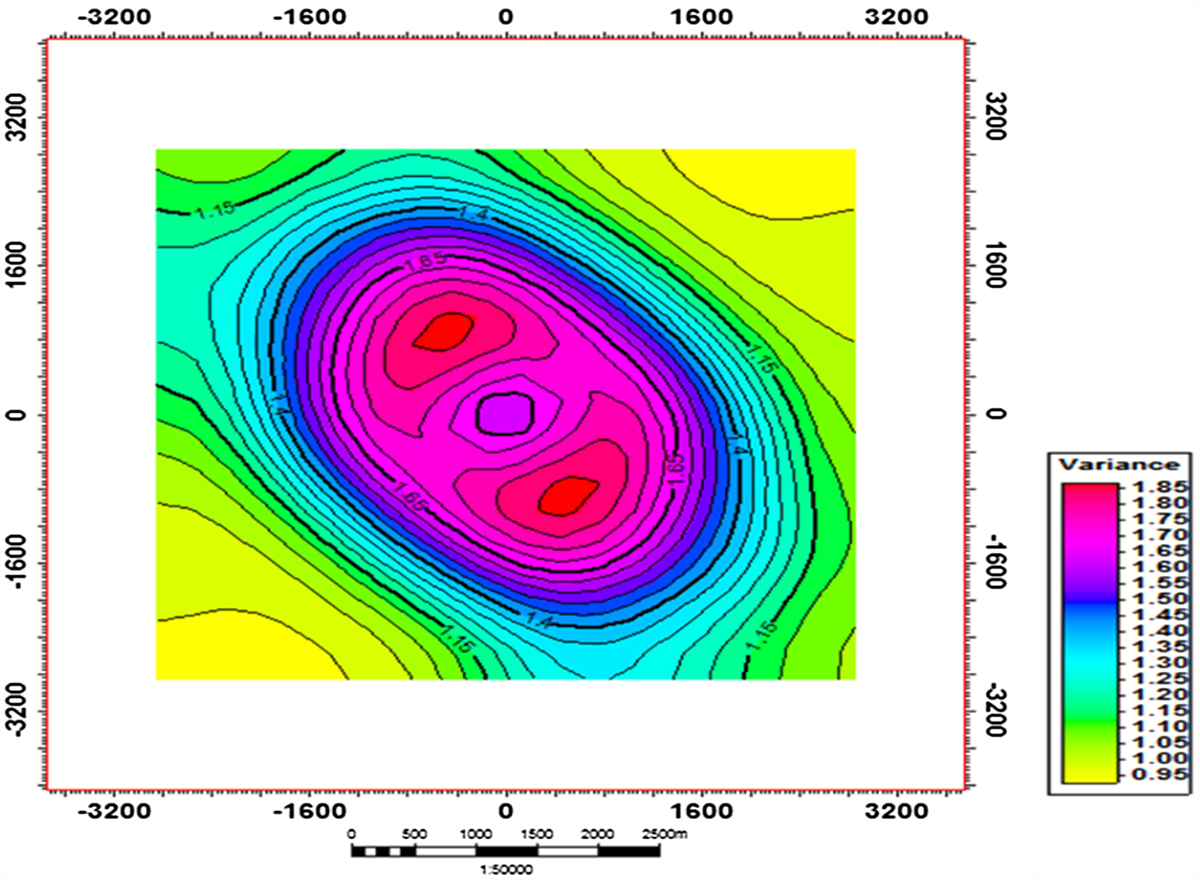
Semi-variogram map for the 3D flow unit model. The less variance contour represents the direction of high degree of continuity of flow units, NW-SE direction.
Semi-variogram map for the 3D flow unit model. The less variance contour represents the direction of high degree of continuity of flow units, NW-SE direction.
Current usage metrics show cumulative count of Article Views (full-text article views including HTML views, PDF and ePub downloads, according to the available data) and Abstracts Views on Vision4Press platform.
Data correspond to usage on the plateform after 2015. The current usage metrics is available 48-96 hours after online publication and is updated daily on week days.
Initial download of the metrics may take a while.