Numerical methods and HPC
Open Access

Fig. 3

image

Download original image

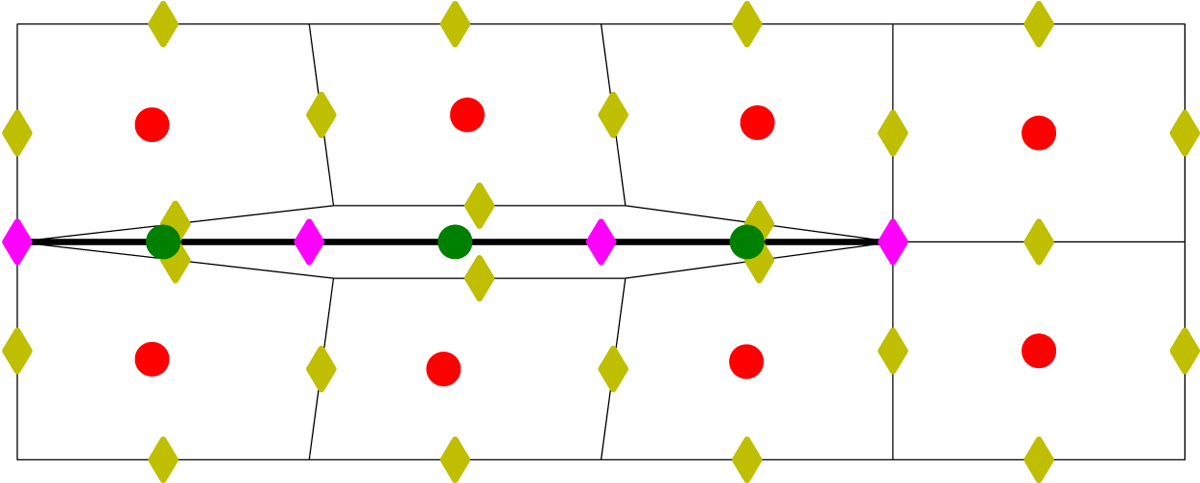
Representation of the degrees of freedom for a 2d and 1d grid. The pressure dof are represented by circles, red for the 2d grid and green for the 1d. The velocity dof are depicted by yellow diamonds for the 2d grid and purple diamonds for the 1d. The nodes of the 2d grid are moved only for visualization purpose.

Current usage metrics show cumulative count of Article Views (full-text article views including HTML views, PDF and ePub downloads, according to the available data) and Abstracts Views on Vision4Press platform.

Data correspond to usage on the plateform after 2015. The current usage metrics is available 48-96 hours after online publication and is updated daily on week days.

Initial download of the metrics may take a while.