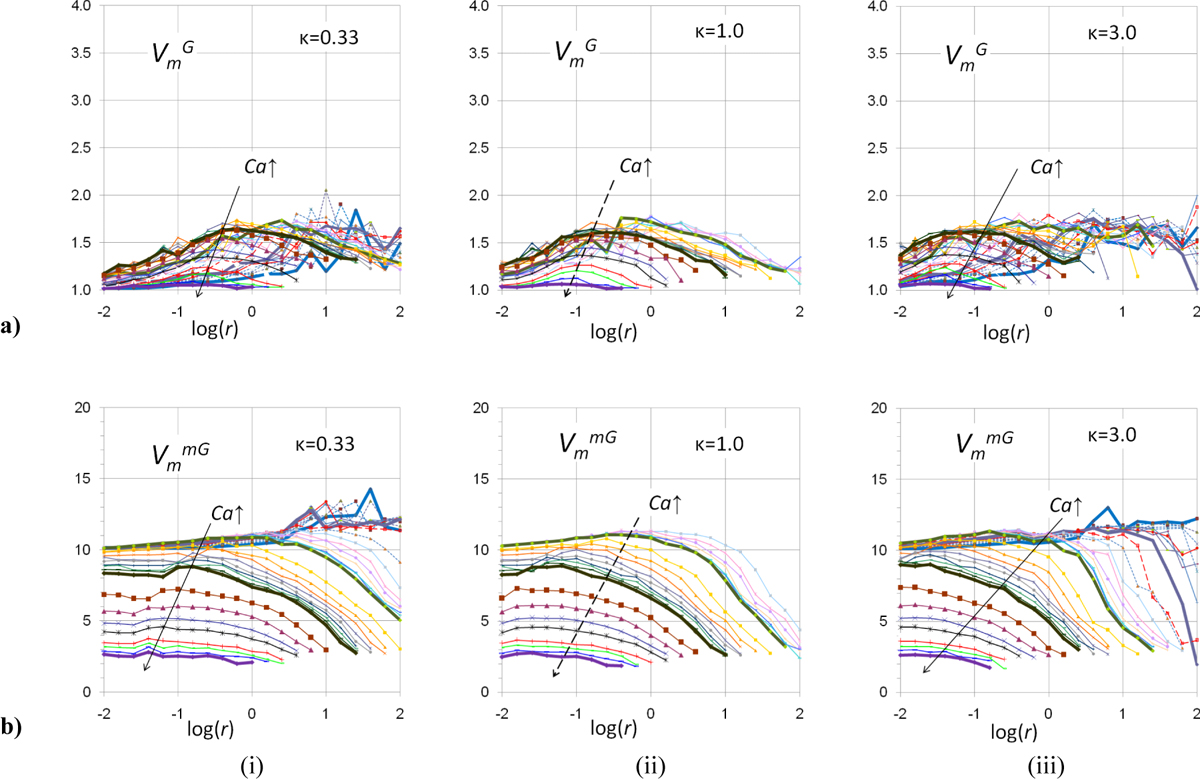
Figure 17

Download original image
Expected, ensemble average macroscopic fractional flows through connected pathways, ηo,C, ganglion dynamics, ηo,G, and drop traffic, ηo,D, flows. Arrows indicate increasing Ca values: →10−8 ≤ Ca ≤ 10−4 and - - - -> 4 × 10⁻⁷ ≤ Ca ≤ 10−4.

