Open Access

Fig. 5

image

Download original image

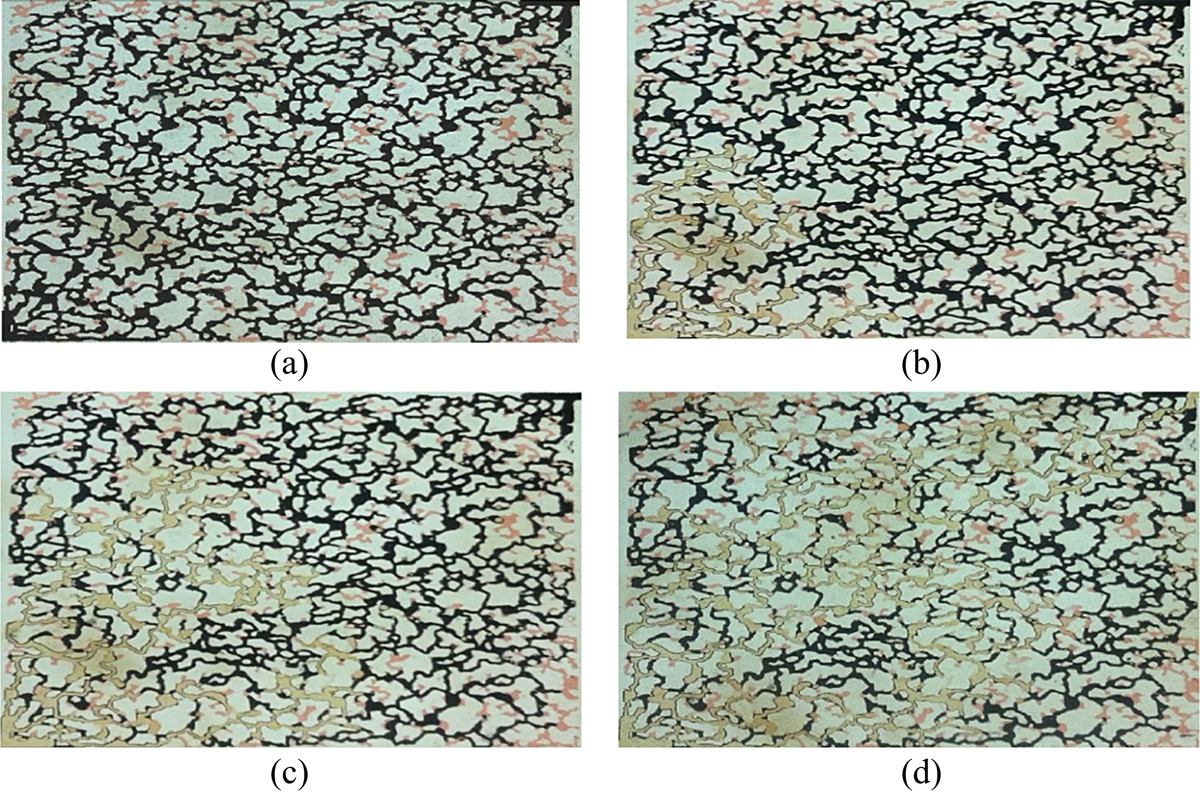
Fluids transport pattern at four dimensionless times during bacteria solution injection (a) t D = 0, (b) t D = 0.29, (c) t D = 0.64, and (d) t D = 1. The white and black represent the bacteria solution and oil phases, respectively.

Current usage metrics show cumulative count of Article Views (full-text article views including HTML views, PDF and ePub downloads, according to the available data) and Abstracts Views on Vision4Press platform.

Data correspond to usage on the plateform after 2015. The current usage metrics is available 48-96 hours after online publication and is updated daily on week days.

Initial download of the metrics may take a while.