Fig. 7
Download original image
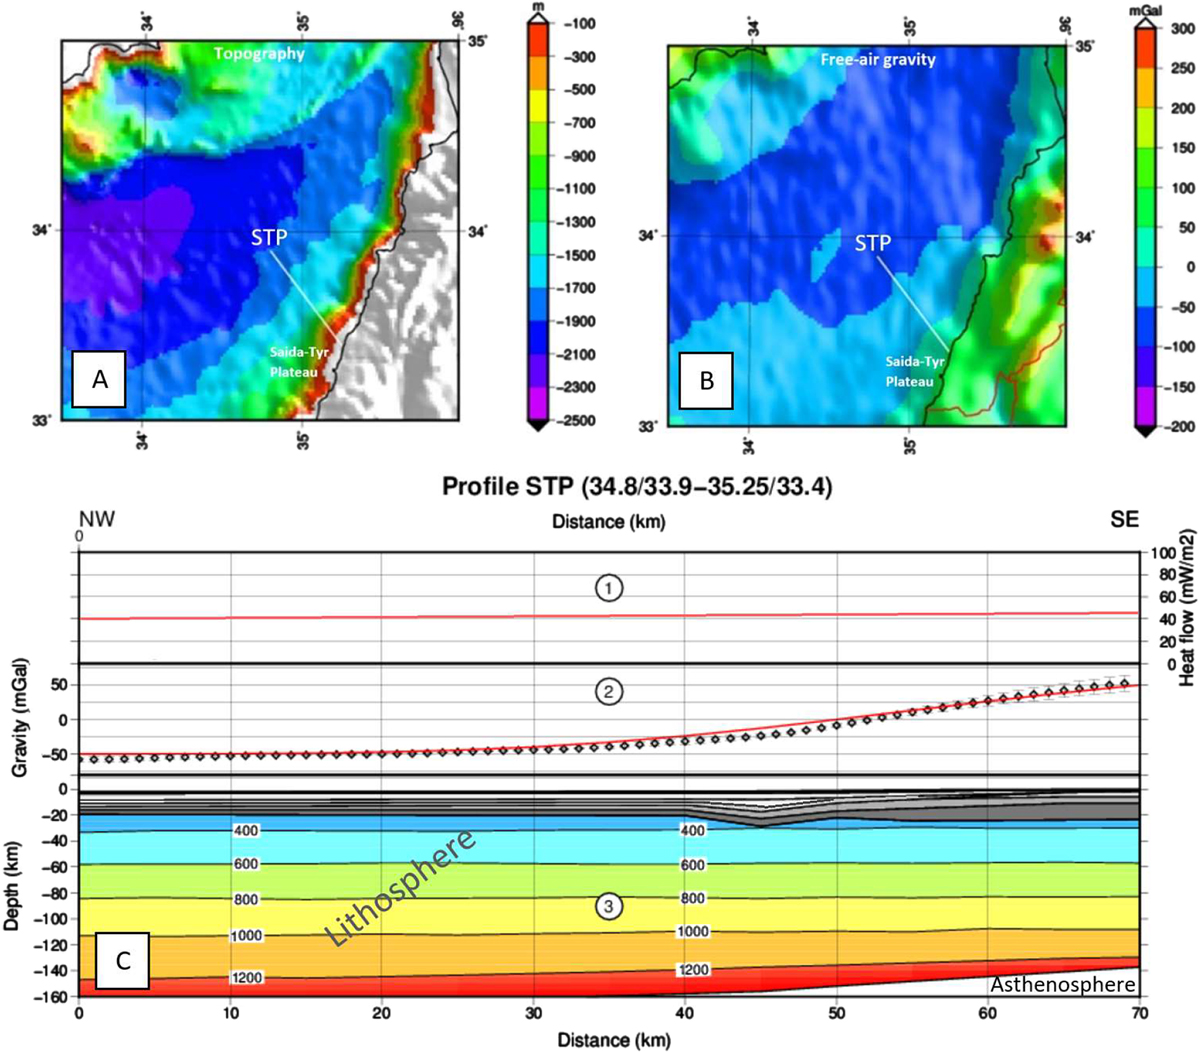
(A), (B) Location of the modeled cross section STP on the topography and free-air gravity maps, respectively (Topex database); (C) Modeling results for profile STP. Graph C1 shows the calculated heat flow for the model. Graph C2 represents the observed gravity anomaly (diamonds: dots with error bars) and the data calculated for the model shown without vertical exaggeration (solid line). The error bars correspond to the data uncertainty for the standard deviation within a range of 5 km to each side of the profile. In graph C3, the crust is represented in grey shades and the lithospheric mantle contains the temperature distribution with isotherms every 200 °C and finally the asthenosphere in white, separated by the Lithosphere-Asthenosphere Boundary (LAB) from the lithosphere.