Figure 14
Download original image
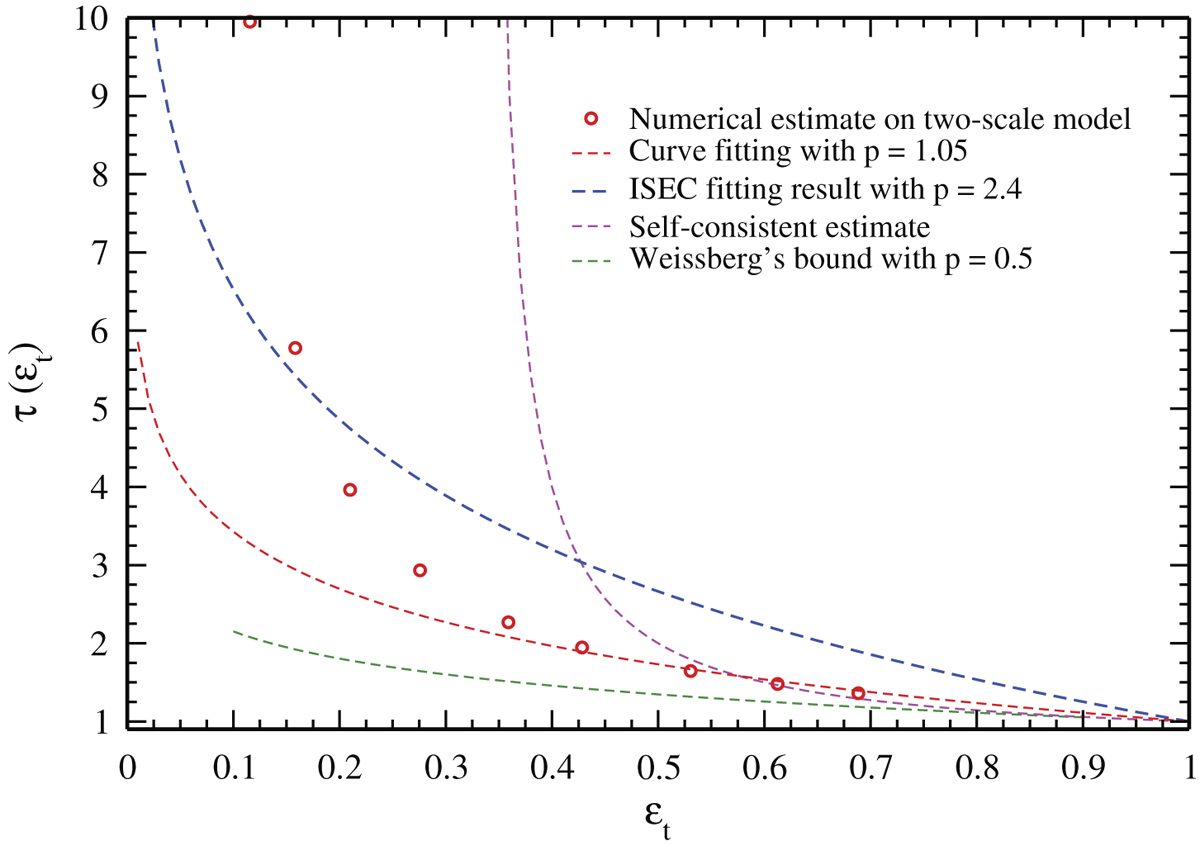
Tortuosity factor τ versus accessible pore volume fraction εt in hindered diffusion. The accessible pore volume fractions εt are numerically measured on microstructures after dilation of size rg. The tortuosity factors are estimated with Equation (23) and corresponding effective diffusion coefficients shown in Figure 13. The red dotted curve is obtained by curve fitting using Equation (6), with the points in εt > 0.4.