Fig. 3
Download original image
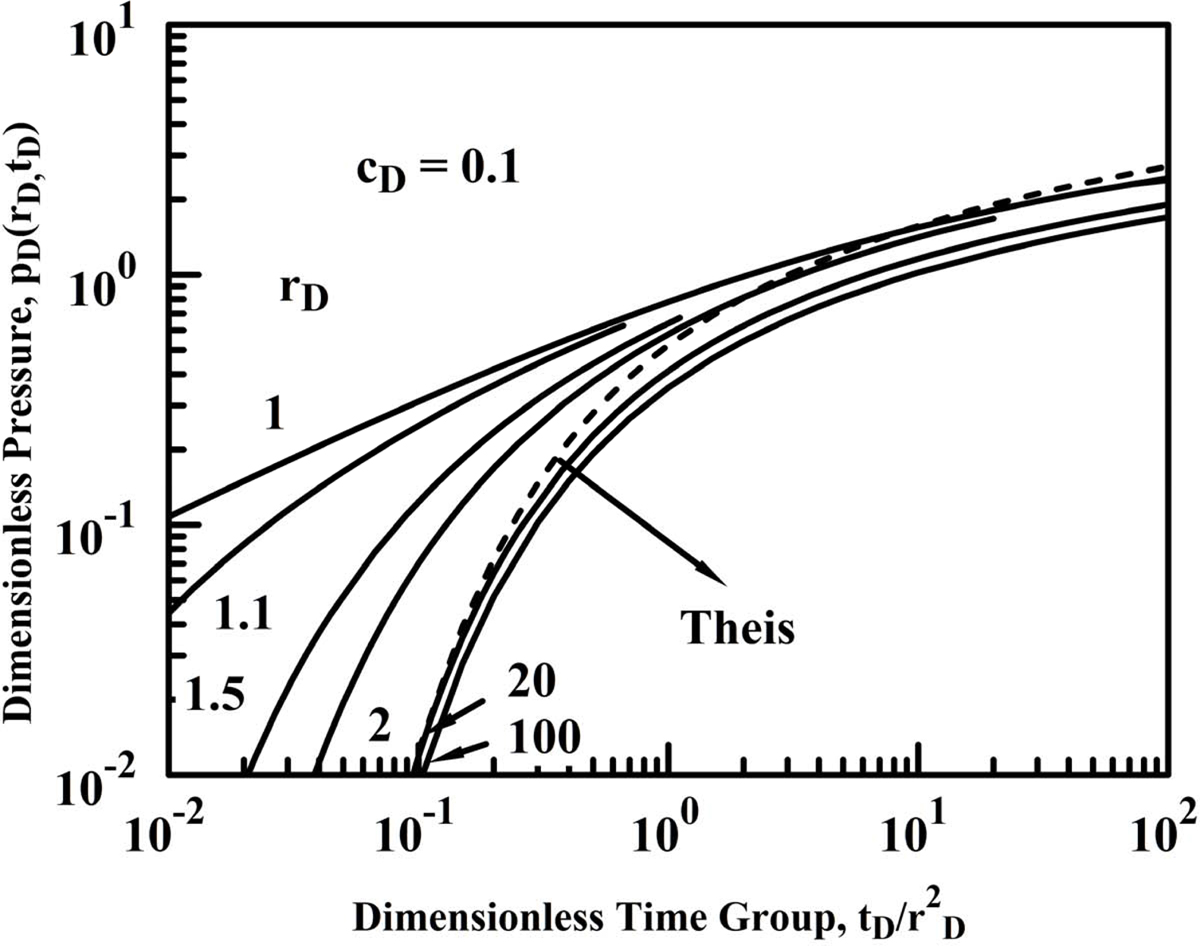
Correlation of pressure distributions along the lines indicated in Mueller and Witherspoon (1965) for a line-source well. For values of rD > 350 pressure responses may be correlated in terms of ![]() for the time range shown for the value of cD considered. At longer times, solutions have to be expressed in terms of
for the time range shown for the value of cD considered. At longer times, solutions have to be expressed in terms of ![]() and rD.
and rD.