Fig. 2
Download original image
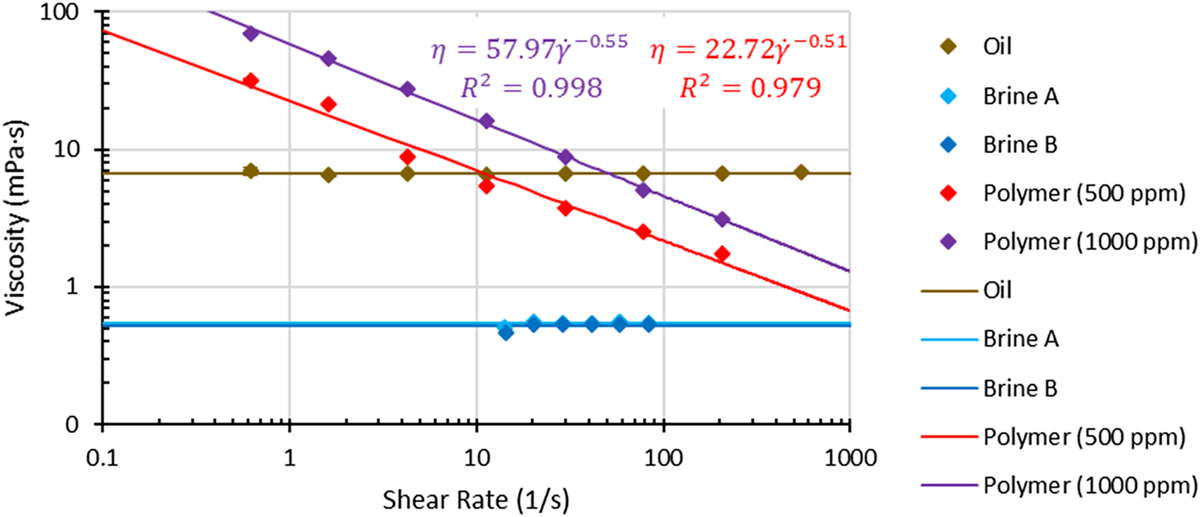
Viscosity of the fluids used in the tests at 60 °C. Note that the polymer viscosity reported in this figure corresponds to the one used in the core flooding experiments, i.e., after the filtration process.
Viscosity of the fluids used in the tests at 60 °C. Note that the polymer viscosity reported in this figure corresponds to the one used in the core flooding experiments, i.e., after the filtration process.
Current usage metrics show cumulative count of Article Views (full-text article views including HTML views, PDF and ePub downloads, according to the available data) and Abstracts Views on Vision4Press platform.
Data correspond to usage on the plateform after 2015. The current usage metrics is available 48-96 hours after online publication and is updated daily on week days.
Initial download of the metrics may take a while.