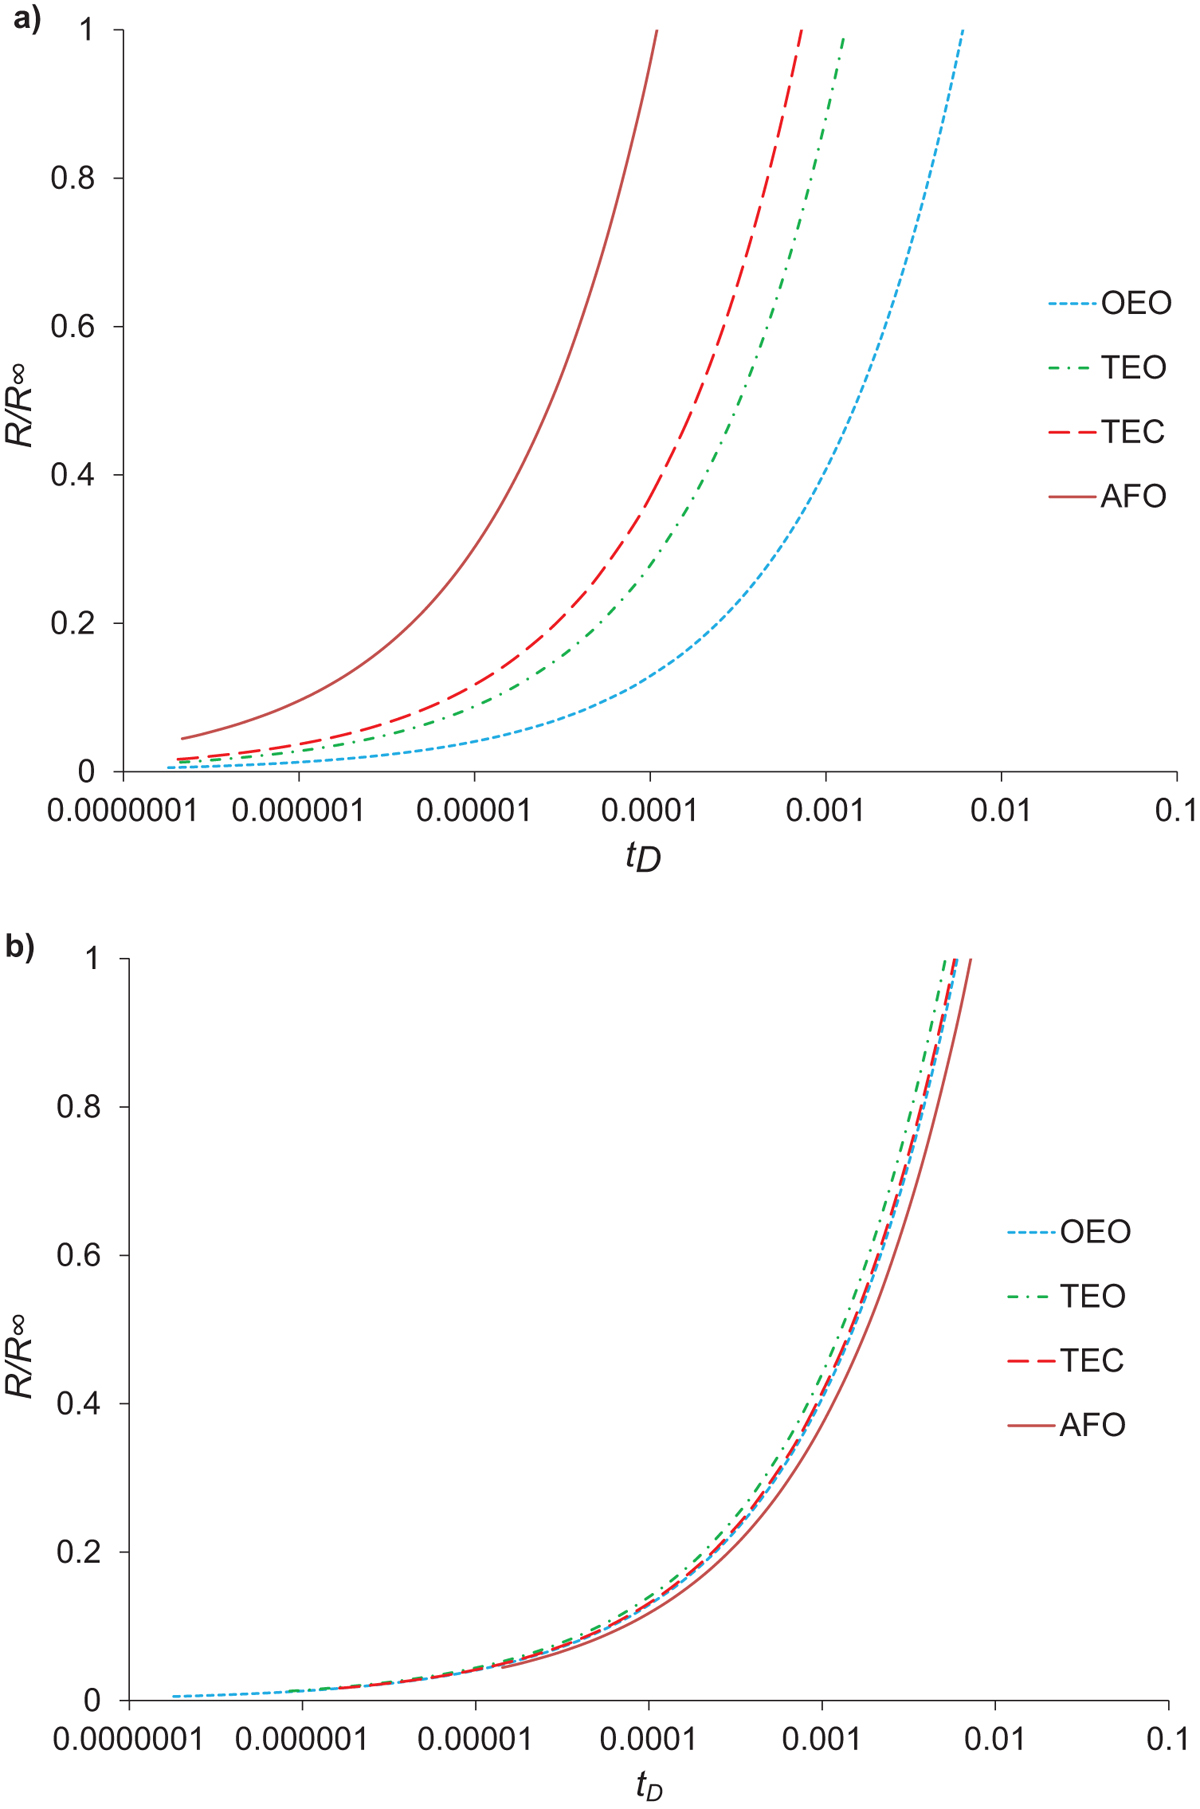
Fig. 7.
Download original image
Recovery of the oil displaced versus time. (a) Time is scaled according to the scaling group proposed by Schmid and Geiger (2012). The data did not scale up curve since the characteristic length per case was not used in the equation. (b) In this graph, we used the equation mentioned in Table 2 to calculate the characteristic length for the different cases presented in Figure 3. We can see that the data falls neatly into almost one single curve indicating that the represented length of the core should be replaced as per the boundary condition requirement.