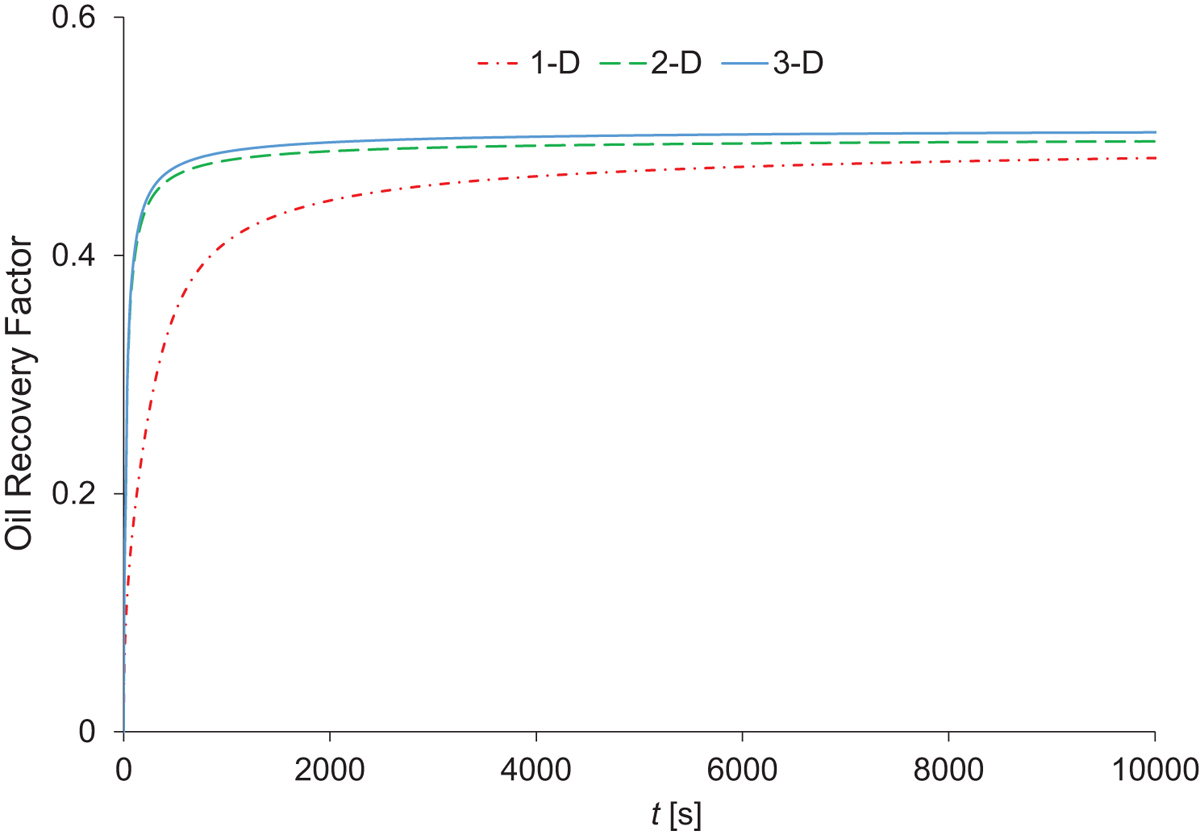
Open Access

Fig. 14.

image

Download original image

The plot shows recovered oil versus time for different grid sizes. There is a significant difference in the amount of oil recovered when you move from 1-D to 2-D. However, this change is minimal between 2-D and 3-D models. This could be attributed to the fact the maximum oil recovery is already reached and thus using 2-D models in satisfactory in this TEO case.

Current usage metrics show cumulative count of Article Views (full-text article views including HTML views, PDF and ePub downloads, according to the available data) and Abstracts Views on Vision4Press platform.

Data correspond to usage on the plateform after 2015. The current usage metrics is available 48-96 hours after online publication and is updated daily on week days.

Initial download of the metrics may take a while.