Fig. 10.
Download original image
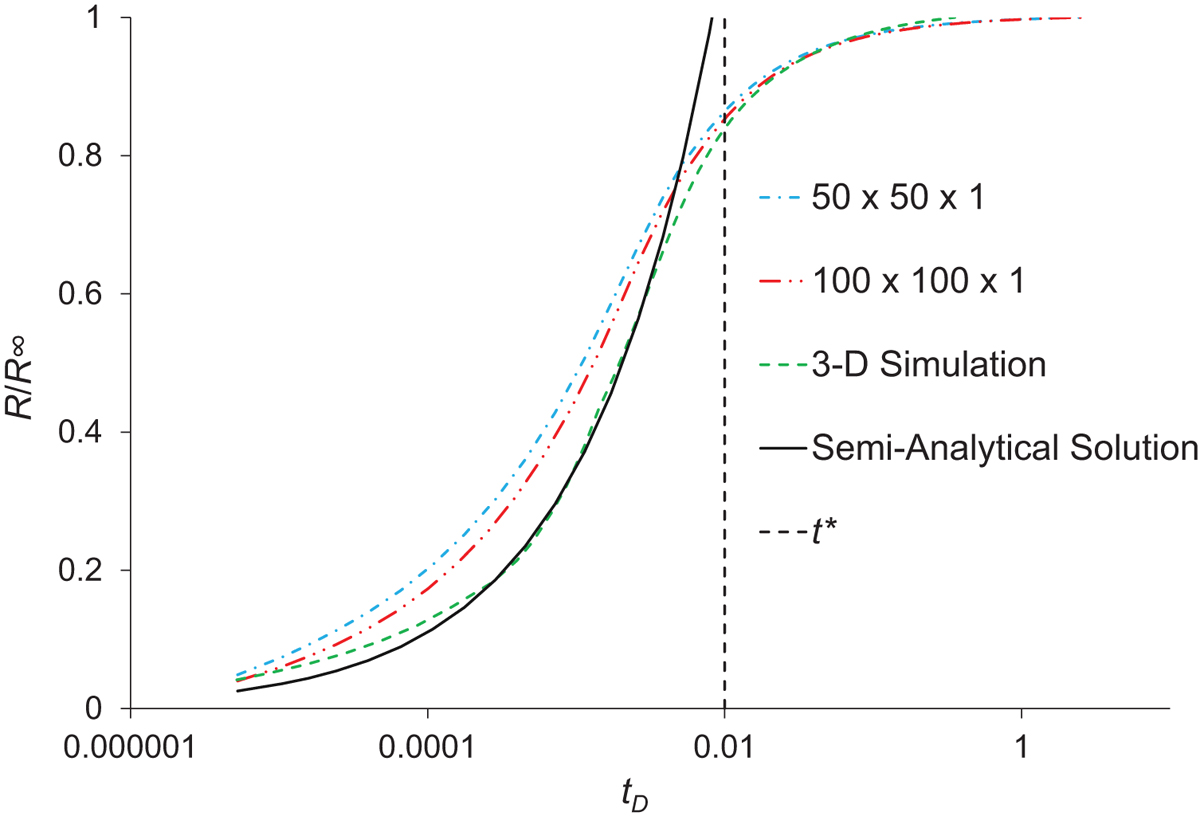
The plot shows the ultimate recovery of oil as function of the dimensionless time. The finer grid size shows clearly a better fit with the semi-analytical solution compared to the 50 × 50 × 1 model. The fit gets even better when even finer grids are used to the areas close to the boundaries and thus allows the capturing of final saturation changes. Moreover, the 3-D model shows the best fit with the semi-analytical solution but it is only valid till the early imbibition time, tD*.