Open Access

Fig. 4

image

Download original image

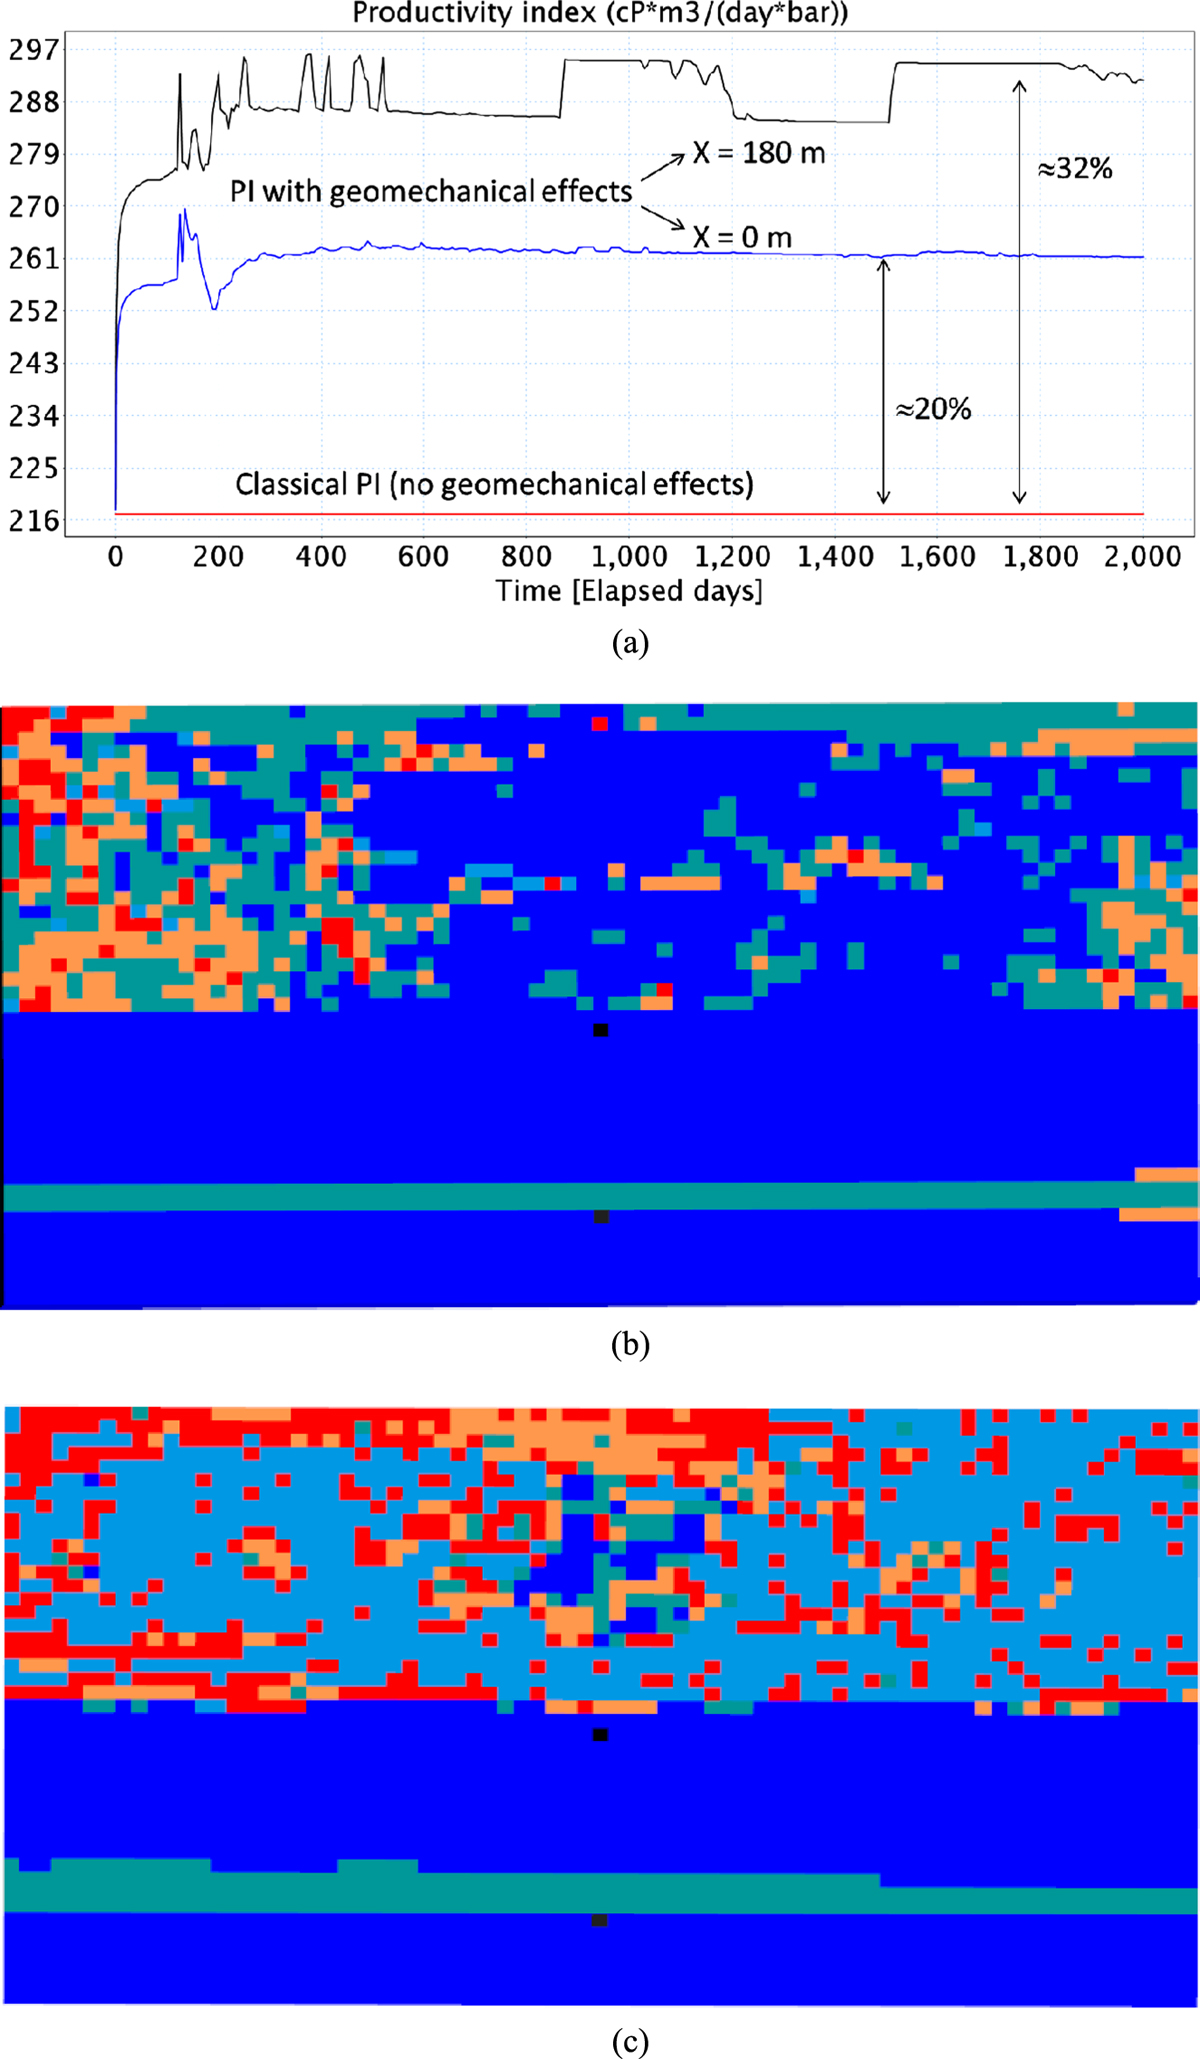
Well productivity index at X = 0 m (blue) and X = 180 m (black) compared to the constant PI for the case without geomechanical effects (red). (b) and (c) are the field maps corresponding to X = 0 m and X = 180 m, respectively; black points on (b–c) are the producer and injector wells position; the facies colors are the same as in Figure 1.

Current usage metrics show cumulative count of Article Views (full-text article views including HTML views, PDF and ePub downloads, according to the available data) and Abstracts Views on Vision4Press platform.

Data correspond to usage on the plateform after 2015. The current usage metrics is available 48-96 hours after online publication and is updated daily on week days.

Initial download of the metrics may take a while.