Table 4
Statistical parameters of the proposed models.
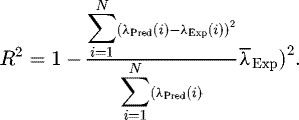
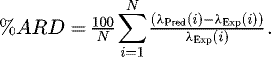
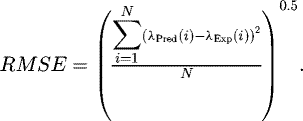
| R2 | ARD | AARD | RMSE | min RD | max RD | ||
|---|---|---|---|---|---|---|---|
| MLP | Train | 0.9841 | −0.0508 | 3.48 | 0.0620 | 0.0125 | 25.43 |
| Test | 0.9617 | −0.1319 | 4.81 | 0.0901 | 0.1090 | 20.68 | |
| All | 0.9800 | −0.0671 | 3.74 | 0.0685 | 0.0125 | 25.43 | |
| GA-RBF | Train | 0.9285 | −0.2548 | 6.73 | 0.1313 | 0.0232 | 19.87 |
| Test | 0.8801 | −3.4229 | 8.82 | 0.1626 | 0.2560 | 21.85 | |
| All | 0.9188 | −0.8916 | 7.15 | 0.1382 | 0.0232 | 21.85 | |
| Train | 0.9687 | −0.4695 | 3.15 | 0.0877 | 0.0156 | 15.26 | |
| CSA-LSSVM | Test | 0.8501 | −6.1658 | 10.64 | 0.1822 | 0.0996 | 87.45 |
| All | 0.9460 | −1.6144 | 4.66 | 0.1132 | 0.0156 | 87.45 | |
| Train | 0.9773 | −0.1700 | 4.06 | 0.0740 | 0.0038 | 23.73 | |
| CHPSO-ANFIS | Test | 0.9575 | 0.2008 | 5.05 | 0.0955 | 0.2521 | 27.15 |
| All | 0.9736 | −0.0955 | 4.26 | 0.0788 | 0.0038 | 27.15 | |
| Train | 0.9869 | −0.0755 | 2.77 | 0.0562 | 0.0031 | 14.12 | |
| CMIS | Test | 0.9627 | −1.2070 | 4.19 | 0.0885 | 0.0570 | 24.26 |
| All | 0.9826 | −0.3029 | 3.05 | 0.0640 | 0.0031 | 24.26 |