Figure 14
Download original image
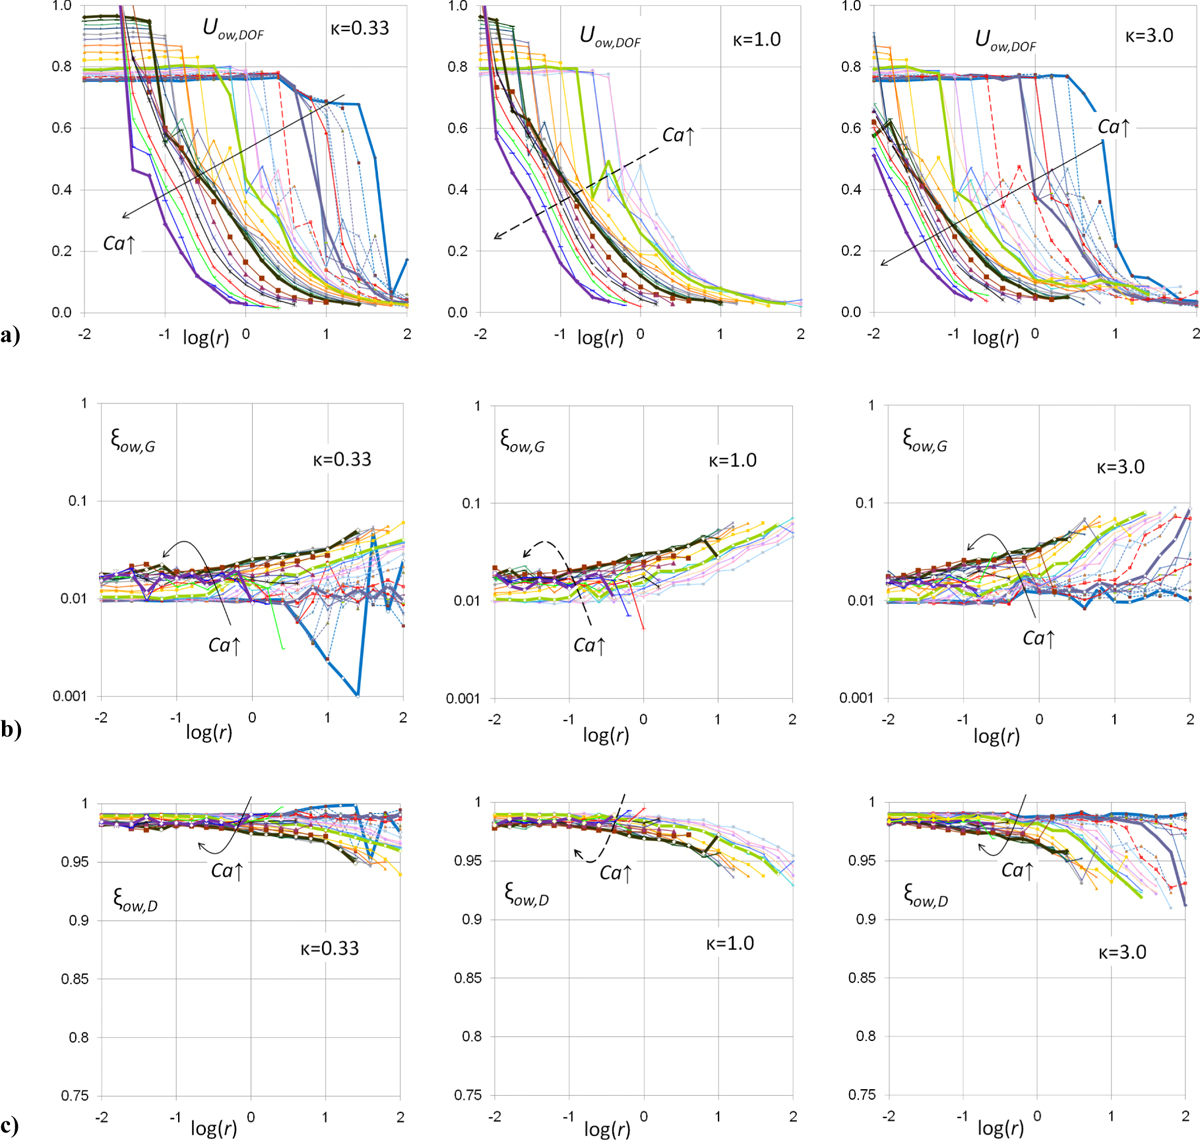
Expected, ensemble average values of the mean ganglion sizes for different values of the capillary number, Ca, and viscosity ratio, κ. a) Mean size of all ganglia (mobilized + stranded), ![]() ; b) mean size of mobilized ganglia,
; b) mean size of mobilized ganglia, ![]() . Arrows indicate increasing Ca values: →10−8 ≤ Ca ≤ 10−4 and - - - -> 4 × 10⁻⁷ ≤ Ca ≤ 10−4.
. Arrows indicate increasing Ca values: →10−8 ≤ Ca ≤ 10−4 and - - - -> 4 × 10⁻⁷ ≤ Ca ≤ 10−4.