Figure 1
Download original image
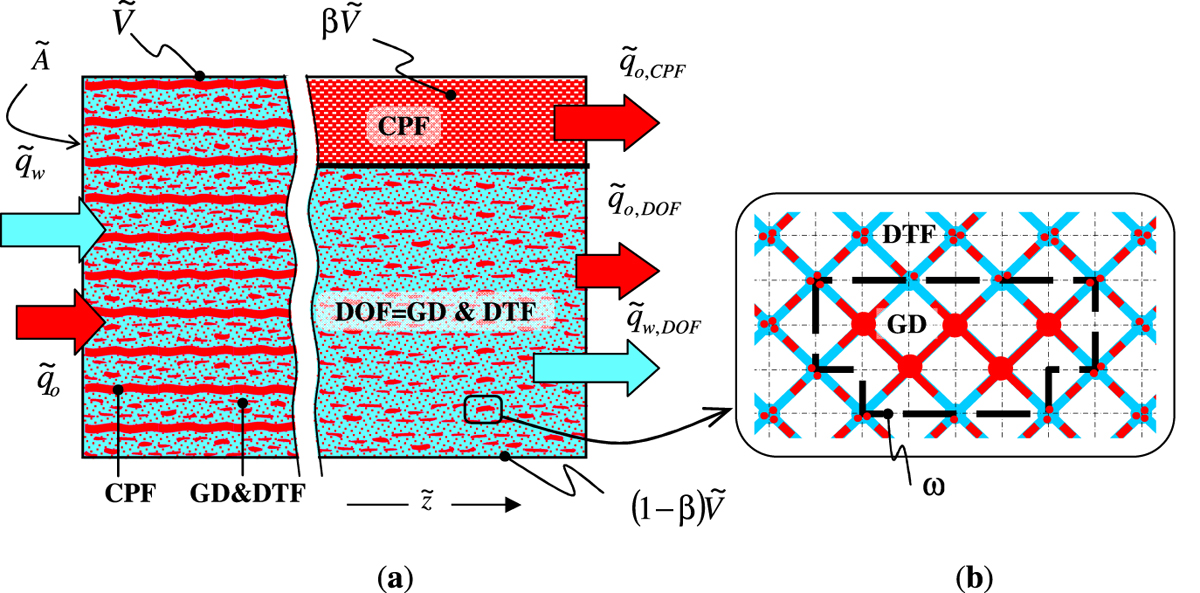
(a) Schematic representation of the actual flow (left sketch) and its theoretical decomposition into prototype flows: Connected-oil Pathway Flow (CPF) and Disconnected-Oil Flow (DOF) (right sketch), (b) A microscopic scale representation (snapshot) of a DOF region. An oil ganglion of size class 5 is shown. For simplicity, all cells are shown identical and the lattice constant is shown expanded (chambers and throats have prescribed size distributions). The dashed, light grid lines define the network unit-cells. The thick dashed line separates the Ganglion Dynamics (GD) cells domain and the Drop-Traffic Flow (DTF) cells domain.